Curated OER
Choices! Choices! Choices!
Students explore the Fundamental Counting Principle and tree diagrams. In this secondary mathematics lesson, students choose three pictures of clothing forma a catalog and create as many outfits as possible. Students then use tree...
Curated OER
Cumulative Frequency
In these word frequency worksheets, students choose a page from a newspaper and count the number of letters in each word and complete their results in a table. Students then calculate the mean number of letters. Students then collect...
Curated OER
M&M Math
Young scholars sort a bag of M&M candies according to color using a sorting mat. They count M&M candies. They compare the number to their prediction then students create tally charts.
Curated OER
Finding the Average Temperature
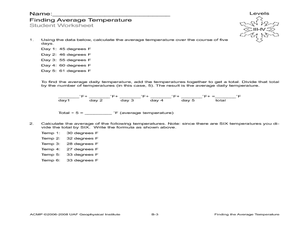
Pupils calculate averages. In this average temperature lesson, students collect data and use their problem solving skills to calculate average temperatures.
Curated OER
Embracing Diversity
Students explore and use different computer programs for collecting data. In this technology based lesson, students set up a survey and use the Excel and Lotus software to collect data.
Curated OER
Inductive vs. Deductive Proof
Twelfth graders differentiate between inductive and deductive proofs. In this differentiating between inductive and deductive proofs lesson, 12th graders compare strengths and weaknesses of each type of proof. Students discuss an...
Curated OER
It's Not Your Fault
Students study the San Andreas Fault, calculate its movements, and compare the movements on both sides. In this earthquake lesson students use the Internet to track movement, and calculate movement using a spreadsheet.
Curated OER
Russian Dolls Investigation
Students measure a set of Russian dolls using the metric system. In this measurement lesson plan, students identify certain relationships between sets of measurements by measuring a set of Russian dolls and presenting their findings to...
Curated OER
Box And Whiskers
Middle schoolers investigate the concept of using box and whisker plots. They demonstrate how to use them to compute median, mode, and range. Students compare and contrast the complete and systematic processes use to solve problems. This...
Curated OER
Land Use Over Time
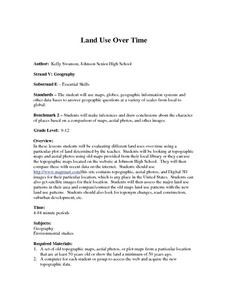
Students view aerial photos and topographic maps of their local area. They compare and contrast major land use patterns over time by comparing these images to maps that are at least 50 years old. They analyze them using the four land use...
Curated OER
How Can They Tell?
Pupils compare the characteristics of arcade tokens to those of a circulating U.S. quarter to determine how a video game can tell the difference between the two. They examine coins and arcade tokens very closely to observe the differences.
Curated OER
Necessary Nitrogen
Students view a video that presents the biogeochemical cycle of nitrogen. They compare types of soils and consider how different fertilizers affect soil composition.
Curated OER
Tallies Tell It All
Students explore data collection through the use of tally marks. After a demonstration of the use of tally marks students complete various inquires where they create a chart documenting the number of times a desired result happens. They...
Curated OER
What are the Odds
Students predict the-outcome of an event. In this algebra lesson, students compare and contrast the probability of an event occurring. They calculate the odds of a simple event and make estimation.
Curated OER
Influence of Union and Confederate Resources in 1860 on the Civil War
Eighth graders compare/contrast population, railroad mileage, manufacturing plants, and industrial workers between the Union and Confederate States in 1860; students analyze effects of the resources of the Union and Confederate Forces on...
Curated OER
Finding Mean, Mode and Median in the Computer Lab
Students create spreadsheets which will display and figure mean, median, and mode of a set of numbers.
Curated OER
Ecology and the Conservation of Natural Resources
Students examine the components of ecosystems. They compare and contrast an ecosystem to an aquatic ecosystem. They examine a local ecosystem and discuss its components.
Curated OER
School Temperatures
Young scholars collect and record temperatures throughout the school. Using this information they compare and contrast the temperatures recorded from various spots throughout the school.
Curated OER
Ecology and the Conservation of Natural Resources Lesson 2
Students compare and contrast abiotic and biotic factors. They discuss how these factors effect ecosystems. They answer questions to complete the lesson.
Curated OER
Photosynthetically Available Radiation (PAR) Measurements
Students calculate the amount of solar radiation hitting the ground at their school compared to the solar constant. They also repeat the experiment at a water testing site and utilize a light probe to measure the light being reflected...
Curated OER
Putting Your Money to Work
Students create a collect data on expenses. In this algebra lesson, students create a spreadsheet to solve scientific equations. They incorporate math, science and technology in this lesson.
Curated OER
Probability
In this Algebra II instructional activity, 11th graders compare and contrast experimental probability and theoretical probability. The two page instructional activity contains explanation of topic, worked examples, and seven practice...
Curated OER
Pioneers Heading West
Students brainstorm, analyze, compare and contrast,
and illustrate accomplishments of pioneers of the west. Students identify and interpret the Pacific Northwest pioneers. Students present their final projects to the class , including...
Curated OER
Heat Energy- Temperature
Second graders investigate the meaning of temperature. They determine what happens to a thermometer when the temperature rises or falls. They place thermometers in different classroom locations in order to compare the temperature in a...


