Curated OER
Religious Book Sales Climb
In this analyzing data worksheet, students review a graph from the USA Today. Students study the graph and answer four questions about the graph. There are also two extension questions included.
Curated OER
Animal Skin
Young scholars investigate the skin surface to body area ratios for different animals. In this seventh/eighth grade mathematics/science lesson plan, students explore heat transfer between an animal’s body and the environment. Using...
EngageNY
Describing Distributions Using the Mean and MAD II
The 11th lesson in the series of 22 is similar to the preceding lesson, but requires scholars to compare distributions using the mean and mean absolute deviation. Pupils use the information to make a determination on which data set is...
American Statistical Association
Bubble Trouble!
Which fluids make the best bubbles? Pupils experiment with multiple fluids to determine which allows for the largest bubbles before popping. They gather data, analyze it in multiple ways, and answer analysis questions proving they...
National Security Agency
Starting a Restaurant
Through an engaging unit, chefs-in-training will sort and classify data using tally charts. Learners will also create bar graphs to display restaurant data and interpret data from bar graphs using a variety of categories. This is a fun...
Inside Mathematics
House Prices
Mortgages, payments, and wages correlate with each other. The short assessment presents scatter plots for young mathematicians to interpret. Class members interpret the scatter plots of price versus payment and wage versus payment for...
Mascil Project
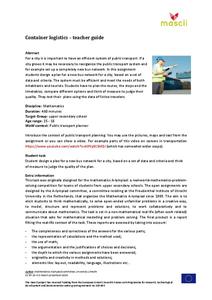
Amberhavn: New Bus Network
Public transportation is an important aspect of any growing city. Collaborative groups work to redesign a system for a city in need of restructuring. Young scholars design a route, create a timetable, and incorporate a quality control...
Virginia Department of Education
Growing Patterns and Sequences
Learners explore, discover, compare, and contrast arithmetic and geometric sequences in this collaborative, hands-on activity. They build and analyze growing patterns to distinguish which kind of sequence is represented by a set of data...
It's About Time
Present-Day Climate in Your Community
So what exactly is climate? This first installment of a six-part series introduces the concept of climate using real-world data tables and topographic maps. The timely lesson includes a comprehensive overview of climate, as well as...
Curated OER
Data Analysis and Probability
Students make their own puzzle grid that illustrates the number of sit-ups students in a gym class did in one minute, then they make a histogram for this same data. Then they title their graph and label the scales and axes and graph the...
Curated OER
How Much Will Movies Cost In The Future?
Students use data collection and analysis, statistics, and probability in problem-solving situations and communicate the reasoning used in solving these problems.
Curated OER
Changing Planet: Permafrost Gas Leak
Pair earth scientists up to use an amazing online arctic portal mapping tool and Google Earth to analyze permafrost changes. They compare changes to data on atmospheric concentrations of methane to see if there is a correlation. Then...
Mathematics Vision Project
Module 9: Statistics
All disciplines use data! A seven-lesson unit teaches learners the basics of analyzing all types of data. The unit begins with a study of the shape of data displays and the analysis of a normal distribution. Later lessons discuss the...
EngageNY
The Mean Absolute Deviation (MAD)
Is there a way to measure variability? The ninth resource in a series of 22 introduces mean absolute deviation, a measure of variability. Pupils learn how to determine the measure based upon its name, then they use the mean absolute...
Bowland
Water Availability
Just how scarce is water in different parts of the world? Through these water lessons, young data analysts use provided data to investigate the scarcity of water in countries of the Middle East and Africa. They use ratios and rates to...
Radford University
A Change in the Weather
Explore the power of mathematics through this two-week statistics unit. Pupils learn about several climate-related issues and complete surveys that communicate their perceptions. They graph both univariate and bivariate data and use...
Space Awareness
Valleys Deep and Mountains High
Sometimes the best view is from the farthest distance. Satellite imaging makes it possible to create altitude maps from far above the earth. A three-part activity has your young scientists play the role of the satellite and then use...
Corbett Maths
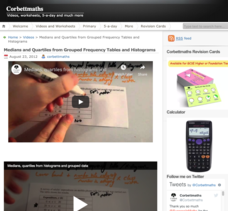
Medians and Quartiles from Grouped Frequency Tables and Histograms
Determine medians within a group. Given data represented as a frequency table of grouped data, the video demonstrates finding an estimation for the median. After finding the group where the median resides, the presenter uses a formula to...
BioEd Online
Butterflies in Space
How does gravity affect the life cycle of a butterfly? Learn first-hand what types of investigations astronauts perform in space by following along with one of NASA's experiments. Create butterfly habitats in the classroom with specific...
Curated OER
Ozone and Temperature Data Analysis, South Pole Antarctica
High schoolers discuss the layers of the atmosphere, and the history of the ozone hole. They discuss the chemistry of the ozone formation. Students compare seasonal data collected with ozonesondes. They compare Antarctic and Arctic ozone...
Curated OER
Sense of Taste
Young scholars swab different sections of the tongue to identify taste buds. In this sense of taste instructional activity, students make predictions and conduct an experiment. Young scholars experiment with a variety of flavors and...
Curated OER
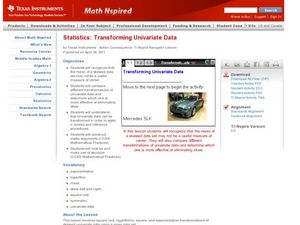
Transforming Univariate Data
Learners analyze plotted data in this statistics lesson. They differentiate between skewed and normal data. They also explore and interconnect exponential growth and decay as it relates to the data.
Pennsylvania Department of Education
Multiplication Represented as Arrays
Third graders collect data about themselves and use in a line plot. In this analyzing data lesson, 3rd graders collect various sets of information,create a line plot and compare the data. Students complete a worksheet on their results.
Curated OER
Reflection on Educational Goal Setting and Self-Assessment
Third graders evaluate their performance at school. They examine their most recent spelling test scores to determine whether or not they met their goals for the test.


