Kenan Fellows
Man vs. Beast: Approximating Derivatives using Human and Animal Movement
What does dropping a ball look like as a graph? An engaging activity asks learners to record a video of dropping a ball and uploading the video to software for analysis. They compare the position of the ball to time and calculate the...
Mathematics Vision Project
Module 4: Linear and Exponential Functions
Sequences and series are traditionally thought of as topics for the pre-calculus or calculus class, when learners are figuring out how to develop limits. But this unit uses patterns and slopes of linear functions in unique ways to bring...
Social Media Toolbox
Social Media Survey
Survey says ... social media is here to stay! How do the pupils in your school use social media? Using lesson four from a 16-part series, The Social Media Toolbox, learners study surveys and create their own. The resource includes...
University of Colorado
Distance = Rate x Time
Every year, the moon moves 3.8 cm farther from Earth. In the 11th part of 22, classes use the distance formula. They determine the distance to the moon based upon given data and then graph Galileo spacecraft data to determine its movement.
CK-12 Foundation
Coefficient of Variation: Diverse Populations
What is the height of school clubs? Learners use sliders to calculate the coefficient of variation for three different school groups. Using the calculations, class members compare the variation in the heights of the groups.
Curated OER
Comparing Value for Money: Baseball Jerseys
Learners step up to the plate as they first complete an assessment task using linear equations to determine the best company from which to buy baseball jerseys. They then evaluate provided sample responses identifying strengths and...
Space Awareness
Making A Sundial
Can people really measure time just by using the sun? Scholars venture outside on a nice, sunny day to build sundials and learn how people measured time 600 years ago. The class builds two different sundials while gaining practice with...
Curated OER
Handling Data- Health Statistics
In this social studies worksheet, students organize 50 country cards into groups. Students analyze a chart and group countries according to lowest, middle, and highest Infant Mortality Rate.
Curated OER
Mean, Median, & Mode
Pupils determine mean, median, and mode. In this problem solving instructional activity, students evaluate a set of data to determine the mean, median, and mode. Pupils work in small groups practicing cooperative learning skills as they...
Curated OER
It's In The Chocolate Chips
Students investigate which brand of chocolate chip cookies contains the most chocolate. They analyze and compare data using Microsoft Word and Microsoft Excel. They communicate the results with Microsoft PowerPoint.
EngageNY
Measuring Variability for Skewed Distributions (Interquartile Range)
Should the standard deviation be used for all distributions? Pupils know that the median is a better description of the center for skewed distributions; therefore, they will need a variability measure about the median for those...
Curated OER
M & Ms in a Bag
Students make predictions about the number and colors of M&M's in a snack size package. They create an Excel spreadsheet to record the data from their small group's bag, create a graph of the data, and discuss the variations of data...
Curated OER
Origami Flight: The Physical Setting
Sixth graders investigate the forces that move certain objects. In this physics lesson plan, 6th graders design and create paper flying objects using origami methods, which they practice flying in different conditions. Students record...
Curated OER
Ink Analysis and Thin Layer Chromatography
Learners explain the process of TLC. They identify at least three components of ink. They analyze data and make conclusions based on laboratory observations.
Curated OER
Taking Count of Biodiversity
Here is a well-designed lesson on biodiversity that should intrigue your charges. In it, pupils compare a natural desert area to a school field to see how habitat destruction affects species diversity. Groups set up transects and collect...
Curated OER
Chromatographic Separation of Methylene Blue and Sodium Fluorescein
Students determine the best solvent system for separating a methylene blue/sodium fluorescein mixture by thin layer chromatography. They conduct an initial TLC separation using ethanol and a different solvent mixture and analyze the data...
Serendip
Is Yeast Alive?
Through two investigations, life science learners determine whether or not yeast is alive. They perform tests for metabolism by providing sugar and observing if gas is produced as a byproduct. They incubate some of the sample for at...
Curated OER
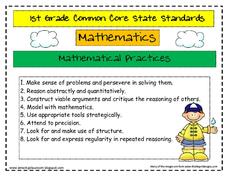
Common Core State Standards 1st Grade Math
Here are the complete set of the math practice standards and the Common Core standards for first grade. They cover operations & algebraic thinking, operations in base 10, measurement and data, and geometry. Illustrated nicely with...
Fluence Learning
Writing About Informational Text: Music and the Brain
Even if you've never picked up a musical instrument, chances are that music has directly impacted your mental and emotional development. Sixth graders engage in a reading activity in which they read two articles on the impact of music on...
Curated OER
Telephone Time
In this telephone time worksheet, learners study, discuss and compare two sets of data when represented on the same graph. Students set up an original graph.
Curated OER
Economic Decisions in Other Systems: Comparative Systems
Students identify and describe the charactertics in each economic system. In groups, they discuss how economic decisions are made in each system and use the Internet to research Chad, United States and North Korea's economic systems. ...
Federal Reserve Bank
Cash Flow and Balance Sheets
What is your car worth? How much do you owe? Individuals create their personal cash flow and balance sheets. They learn the difference between an asset and liability using their personal information to complete the activity.
Scholastic
Study Jams! Double-Line Graphs
With two summers of babysitting money, Mia needs a way to compare her earning from both years. Show your learners that they can organize the data onto a double-line graph to easily compare which summer was more profitable. The lesson...
University of Wisconsin
Follow the Drop
Young surveyors look for patterns in water flow around campus. Using a map of the school (that you will need to create), they mark the direction of the path of water. They also perform calculations for the volume that becomes runoff. The...


