Wild BC
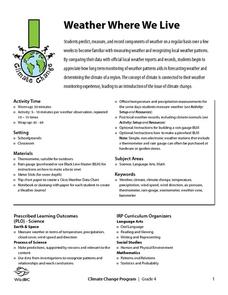
Weather Where We Live
Over a span of two weeks or more, mini meteorologists record weather-related measurements. What makes this particular resource different from others covering similar activities are the thorough details for the teacher and printables for...
Curated OER
Breakfast Cereal - How Nutritious Is Yours?
Students analyze the nutritional value of breakfast cereal in order to make an informed choice. They create a stem and leaf plot which analyzes the nutritional value of the cereal they eat on a regular basis. Students write a letter to...
Curated OER
Snow Cover By Latitude
Students create graphs comparing the amount of snow cover along selected latitudes using data sets from a NASA website. They create a spreadsheet and a bar graph on the computer, and analyze the data.
Curated OER
COMPARING BUDDHISM AND CONFUCIANISM
Students conduct research into the two largest religions of Asia that are Buddhism and Confucianism. They set out to find the similarities and differences with the help of a graphic organizer.
Curated OER
Univariate Data Analysis
Students use given data to compare baseball players. They create box and whisker plots to compare the players and determine which they feel is the best player. Students use calculators to make box and whisker plots. They write paragraphs...
Curated OER
How Many More on a Graph?
First graders examine data on a graph and determine which variable on the graph has more. They draw pictures of their family members and determine which families have more members than other families. Using squares of paper to depict...
Curated OER
Creating and Reading a Pictograph
Second graders examine how data can be transferred into pictures on a pictograph. They analyze data on a graph about chewing gum, and create a pictograph that illustrates data about their preferences for the taste of bubble gum. ...
Curated OER
Measuring to the Nearest Inch
Third graders use whole numbers and fractions to make connections between abstractions of the mathematical world and the real world. In this fractions and measurement lesson, 3rd graders identify, quantify groups , and measure distances....
Curated OER
The Accuracy of Climate Data
Students use maps to determine how accurate climate data really is. They also answer questions using a table of data.
Curated OER
Environmental Graphing
Students experiment with graphing. In this graphing introduction lesson, students complete four activities: 1) a bar graph based on class birthdays 2) an estimation graph of the raisins in raisin bread 3) another estimation example with...
Curated OER
Collecting Data and Graphing
Eighth graders, in groups, count the different colors of M&M's in each kind of package and then draw a pictograph to show the results. Each group writes a program to show their results and then compare the manually-drawn and computer...
Kenan Fellows
Reading Airline Maintenance Graphs
Airline mechanics must be precise, or the consequences could be deadly. Their target ranges alter with changes in temperature and pressure. When preparing an airplane for flight, you must read a maintenance graph. The second...
Big Kid Science
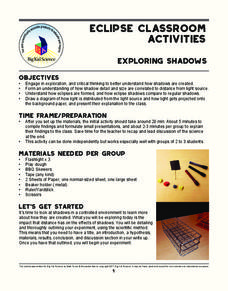
Exploring Shadows
What's that lurking in the shadows? An activity that demonstrates how eclipses happen. Science scholars investigate how light and distance interact to form shadows. The experiment uses simple materials to generate data and observations...
Curated OER
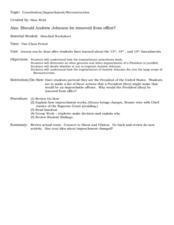
Constitution/Impeachment/Reconstruction
Eleventh graders analyze a chart comparing U.S. census data from 1850, 1880, 1900, and 1920. They read a handout summarizing immigration legislation from 1882-1996 and create a graph charting how open / closed U.S. immigration is over time.
Columbus City Schools
Making Waves
Learning about waves can have its ups and downs, but a demo-packed tool kit has the class "standing" for more! Learners gain experience with several different wave types, organizing observations and data, and wave terminology. The...
Curated OER
Probability and Expected Value
Students collect data and analyze it. In this statistics lesson, students make predictions using different outcomes of trials.
National Park Service
Should America Have Gone to War in 1812?
Using an incredibly engaging activity and detailed lesson plan, your learners will serve as advisors to President Madison on whether to participate in what would become the War of 1812! Utilize a variety of effective instructional...
Virginia Department of Education
Mystery Iron Ions
Young chemists perform an experiment to determine if a compound is iron (II) chloride or iron (III) chloride. Then they determine the formula, balance the equation, and answer analysis questions.
Curated OER
Comparing Temperature, Pressure, and Humidity
Learners investigate data on temperature, pressure, and humidity by downloading information from the ARM Website. Working in groups, they discover how weather impacts life in each of the ARM sites. They record weather data in their...
Curated OER
Ready, Set, Tech
Students oabsrve pictures of a Brachiosaurus and an Apotosaurus. They discuss how features are similar, and different. Students list data in a Venn diagram. They visit book mark websites. Students write three facts on how to saurpods...
Georgia Department of Education
The Basketball Star
Have learners use math to prove they are sports stars! Assess a pupil's ability to create and analyze data using a variety of graphs. The class will be motivated by the association of math and basketball data.
Curated OER
Mean and Standard Deviation
Get two activities with one activity. The first activity, is appropriate for grades 6-12 and takes about 20 minutes. It introduces the concept of measures of central tendency, primarily the mean, and discusses its uses as well as its...
Curated OER
How's The Weather?
Students make a box and whiskers plot using the TI-73 graphing calculator. Each student would have their own calculator but they would work in small groups of two or three to help each other enter the data and make the plots.
Curated OER
Probability: The Study of Chance
Learners conduct an experiment, determine if a game is fair, and collect data. They interpret data, then display line graph. They conduct analysis of game for probability.


