Curated OER
Excel temperature Graphs
Learners gather data about the weather in Nome, Alaska. In this Nome Temperature lesson, students create an excel graph to explore the weather trends in Nome. Learners will find the average weather and add a trend line to their graph.
Teach Engineering
Understanding the Air through Data Analysis
Is there a correlation or causation relationship between air pollutants? Groups develop a hypothesis about the daily variation of air pollutants, specifically ozone and CO2. Using Excel to analyze the data, the groups evaluate their...
Curated OER
Graphing the Standard Curve
Students analyze colorimetric using a computer program. In this science lesson, students show application of standard curves by finding other areas of science where standard curve is analyzed.
Curated OER
This Little Light of Mine
Elementary schoolers discover how electricity travels and create an electron flow through a closed circuit. They work together to make a closed circuit and observe the electricity being made. This outstanding lesson plan is well worth...
Teach Engineering
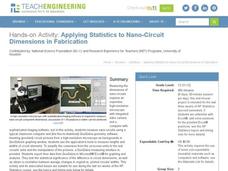
Applying Statistics to Nano-Circuit Dimensions in Fabrication
Do flexible circuits change dimensions during fabrication? Groups use GeoGebra software to measure the length of pictures of flexible nano-circuits. To determine if the circuits change dimensions, future engineers use Microsoft...
Space Awareness
Navigation in the Ancient Mediterranean and Beyond
Ancient texts, like Homer's Odyssey, mentions navigating ships by observing constellations. Pupils learn about the link between history and astronomy as they relate to navigation in the Bronze Age. Scholars complete two hands-on...
Curated OER
Graphing the Standard Curve
Srudents demonstrate analysis of colorimetric assay results by analyzing them using a computer graphing program and demonstrate application of standard curves by finding other areas of science that can utilize standard curves in analysis...
Curated OER
Global Water Cycle & Heat Flow
Students experiment to discover how different variables affect the water cycle. They do hat flow experiments and construct a computer heat flow model.
Curated OER
Plants Under Attack
Third graders will identify the four needs for plant survival and gain skills and confidence in using scientific measurement tools, probes as well as the spreadsheets and graphing capacity of a computer to represent and analyze data.They...
Curated OER
Ghost Crystals - Light & Water
Woo, ghost crystals, just in time for Halloween! Young scientists experiment with light and water as they make and observe ghost crystals. The lesson does not include the process for making the crystals, but provides a web link where a...
Curated OER
Science in baseball
Sixth graders examine how science is used in everyday activities, such as baseball.
Curated OER
Global Warming Statistics
Students research and collect data regarding temperature changes for a specific location and find the mean, median, and mode for their data. In this climate change lesson, students choose a location to research and collect data regarding...
Curated OER
Pumped Up Gas Prices
Students calculate gas prices. In this transportation instructional activity, students tally the mileage and gas costs of their car for one months. They figure out how much was spent on gas and create a graph showing average gas prices...
Curated OER
Rain Gardens for Controlling Excess Runoff
Students address the idea that human beings live within the world' ecosystems. They discuss how humans modify ecosystems as a result of population growth, technology, and consumption. Students discuss how the human destruction of...
Curated OER
Light Is Amazing
Students investigate light and its energy. They discuss the properties of light, research how much light the moon absorbed on their birthday on a website, complete a graphic organizer, and create a kaleidoscope.
Curated OER
Recycle! Recycle! Recycle!
Students investigate recycling and reusing. They view an online video, create an recycled art collage using picture files in Inspiration software, and write a choral poem about recycling.
Curated OER
Charting Seasonal Changes
Students research the Earth's patterns of rotation and revolution, create a chart and graph of these patterns and use them to explain the causes of night and day and summer and winter.
Curated OER
How Does A Seed Become A Plant?
First graders evaluate what it takes for a seed to become a plant. They brainstorm what they know, discuss what they want to know and interact with a Plant WebQuest that indicates what they have learned. They also examine how we get the...
Curated OER
Learning the Sense of Smell
Students learn about the sense of smell and the nose. In this senses lesson, students read The Honey Bee and the Robber, discuss how a bee uses its sense of small and get an introduction on what they sense of smell is. ...
Curated OER
Virial Theorem Lesson
Ninth graders describe how equilibrium can occur as the balance of two effects. They model the stability of elliptical galaxies based on how fast stars within the galaxy are moving.
Curated OER
Using SWMP Data
Students are introduced to the SWMP system which tracks short-and long-term changes in water. Using this data, they plot and interpret the data on a graph to determine how human activities are lowering the water quality. They also...
Curated OER
Graph the Density of Fruit
Fifth graders review the definition of mass and volume. They calculate and graph the density of various types of fruit while working in groups on a spreadsheet program. They look at how size of the fruit can be similar but the weight is...


