Computer Science Unplugged
The Poor Cartographer—Graph Coloring
Color the town red. Demonstrate the concept of graph theory with a task that involves determining the least number of colors needed to color a map so that neighboring countries are not represented by the same color. Pupils...
Illustrative Mathematics
Counting Squares
Challenge young mathematicians' understanding of squares with this geometry puzzle. The task is simple, identify as many squares as possible in a 3x3 array. Allow learners to work independently or in pairs as they search for squares,...
Illustrative Mathematics
Find the Angle
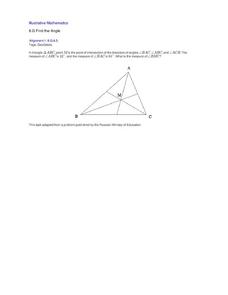
This a fun problem for young geometers to play with while gaining important insight into deductive reasoning. Some will find the answers very quickly, others might take a less direct path, but all will use their knowledge of the sum of...
Curated OER
Building a Quadratic Function Form
Comparing the movement of graphs geometrically when small changes are made to the parent function motivates this collaborative discussion on the transformations of functions to their various forms. Vertical and horizontal shifts due to...
Illustrative Mathematics
Congruent Triangles
Geometers prove that triangle PQR is congruent to triangle ABC by describing any combination of rotations, reflections, and translations that would prove it so. There is only this single task on the handout, but a detailed explanation of...
Illustrative Mathematics
Finding an Unknown Angle
Teach your class how to apply their knowledge of geometry as they explore the unknown. In order to find an unknown angle, students must understand that rectangles have four interior right angles, that right angles have 90 degrees, and...
Illustrative Mathematics
Identifying Even and Odd Functions
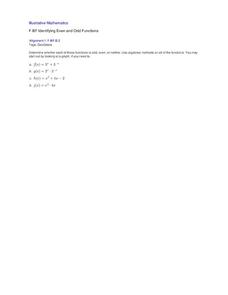
Use a worksheet to give learners practice in identifying even and odd functions. The problems on this page are also appropriate for use as assessment items, or you can use them with GeoGebra to interactively present concepts. The task is...
Illustrative Mathematics
Graphs of Compositions
It might help when working with this resource to give an example of a composition function. For example, the amount of time it takes to get to work depends on the amount of traffic; the amount traffic depends on the time of day....
Curated OER
"The Soil Around Us" Project
Students explore how to storyboard. They examine the tasks and roles involved in creating a multimedia presentation. They create a list of quality attributes for the presentation. Use the list to improve the style, accuracy and...


