Baylor College
Body Mass Index (BMI)
How do you calculate your Body Mass Index, and why is this information a valuable indicator of health? Class members discover not only what BMI is and practice calculating it using the height and weight of six fictitious individuals, but...
UAF Geophysical Institute
Carbon Footprint
Your young environmentalists can calculate their carbon footprint and discuss ways to reduce it with a worksheet about climate change. After reading a handout about what impact one's carbon footprint can have on the environment, kids...
Teach Engineering
Penny Perfect Properties (Solid-Liquid Interations)
I can get more water to stay on a penny than you can! Collaborative pairs determine the volume of liquids that can be contained on the surface of copper pennies and plastic coins. The pairs analyze their results using graphs and go on to...
Curated OER
The Wave of the Future
Twelfth graders discuss sine curves and enter equations into their graphing calculator then compare different graphs created on their calculators. They identify the period, amplitude and phase shift given the graph or the equation of a...
Curated OER
A Sweet Drink
Students investigate reaction rates. In this seventh or eighth grade mathematics lesson, students collect, record, and analyze data regarding how the temperature of water affects the dissolving time of a sugar cube. Studetns determin...
Curated OER
What Can I Afford?
Learners explore the concept of cell phone plans. In this cell phone plan lesson, students research the cost of cell phones. Learners compare various cell phone plans and decide on which phone plan is best for them.
Curated OER
Graphing Linear Equations
Students graph linear equations. In this algebra lesson, students investigate the price of tolls in different states and create a graph. They analyze their graph and draw conclusions.
Curated OER
Technobiz
Learners examine candy preferences to create a plan in order to improve candy sales. In this technobiz lesson, students build spreadsheet and organizational skills by graphing and calculating data. Learners are introduced to terminology...
Curated OER
Diffusion
Students design and carry out an experiment according to the scientific method. The experiment must test the effects of time and concentration on the rate of diffusion of potassium permanganate into potato cubes. After performing the...
Curated OER
Basic Excel
Students explore basic Excel spreadsheets. In this spreadsheet lesson plan, students enter Alaska weather information and perform calculations. Students title the columns on the spreadsheet and format the cells. Students complete...
Chicago Botanic Garden
Micro-GEEBITT Climate Activity
A truly hands-on and inquiry based learning activity bridges all the lessons in the series together. Beginning with a discussion on average global temperatures, young meteorologists use real-world data to analyze climate trends in order...
Curated OER
Investigation--What's The Number?: Exponents
Eighth graders explore exponents and look for patterns that help to determine the ones place when the base is raised to any power. They use trial and error and seek general solutions. Also, identify patterns in a number sequence.
Curated OER
Chart the Stars
Seventh graders find constellation distances and plot the stars. In this star lesson, 7th graders plot the star points for Canis Major. Students use graphing calculators to graph the constellation. Students choose another constellation...
Virginia Department of Education
Solution Concentrations
What happens when you combine 6.022 times 10 to the 23 piles of dirt into one? You make a mountain out of a mole hill. Scholars use dehydration to obtain percent composition and then calculate the molarity of the original solution.
Curated OER
Big Wheels Keep on Turning
Eleventh graders work in groups and investigate how force determines the speed and distance then they view the video, "Math Vantage #7: What's Your Angle?." They are given a real life problem to solve using speed, ramps, angle, incline...
Explore Learning
Quadratics: Polynomial Form
Throught this subscription-based sight, learners explore different aspects of the parabola by changing equations from standard to vertex form. Next, find the general form of the vextex based on the values of a, b, and c, and investigate...
Colorado State University
If You Can't Predict the Weather, How Can You Predict the Climate?
Why is the weather man wrong so often? Young climatologists discover how chaos rules both weather and climate through a math-based activity. Using an iterative equation, the class examines how small day-to-day weather events total up to...
University of California
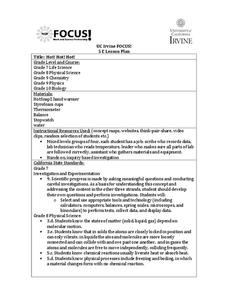
Hot! Hot! Hot!
Calories are not tiny creatures that sew your clothes tighter every night, but what are they? A science lesson, presented at multiple levels, has learners experiment with heat, heat transfer, and graph the function over time. It also...
Chicago Botanic Garden
Weather or Not
What is the difference between weather and climate? This is the focus question of a instructional activity that takes a deeper look at how weather data helps determine climate in a region. Using weather and climate cards, students decide...
Curated OER
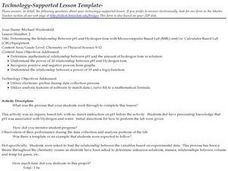
Determining the Relationship Between pH and Hydrogen Ions with Microcomputer Based Lab (MBL) and/or Calculator Based Lab (CBL) Equipment
Pupils find the relationship between the variables based on experimental data. They determine mathematical relationship between pH and the amount of hydrogen Ions in solution.
Curated OER
Data Days
Sixth graders practice collecting, organizing and displaying data. They create circle, bar, line and picto graphs. They analyze data in small and large sample groups.
Curated OER
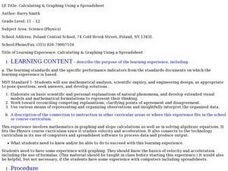
Calculating & Graphing Using a Spreadsheet
Students use the lab apparatus to calculate the average velocity and average acceleration at several points and record the data. They use the spreadsheets to plot distance vs. time, velocity vs. time and acceleration vs. time graphs.
Curated OER
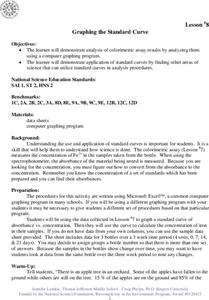
Graphing the Standard Curve
Srudents demonstrate analysis of colorimetric assay results by analyzing them using a computer graphing program and demonstrate application of standard curves by finding other areas of science that can utilize standard curves in analysis...
Curated OER
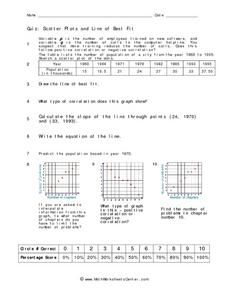
Quiz: Scatter Plots and Line of Best Fit
In this scatter plots and line of best fit worksheet, students create scatter plots from given sets of data. They answer questions concerning the scatter plot. Students write the equation of a line, identify the type of correlation...


