Curated OER
Linear Progression
Learners use graphing calculators to graph lines and create tables of values. They perform an experiment using M&M's and slinkys, then create their tables based on their results.
Curated OER
How Fast Is Your Car?
Eighth graders discover the relationship between speed, distance, and time. They calculate speed and represent their data graphically. They, in groups, design a ramp for their matchbox car. The goal is to see who's ramp produces the...
EngageNY
Mid-Module Assessment Task: Grade 8 Module 6
Make sure pupils have the skills to move on to the second half of the module with a mid-module assessment task. The formative assessment instrument checks student learning before moving on to the rest of the lessons in the unit.
Inside Mathematics
Rhombuses
Just what does it take to show two rhombuses are similar? The assessment task asks pupils to develop an argument to show that given quadrilaterals are rhombuses. Class members also use their knowledge of similar triangles to show two...
Teach Engineering
Understanding the Air through Data Analysis
Is there a correlation or causation relationship between air pollutants? Groups develop a hypothesis about the daily variation of air pollutants, specifically ozone and CO2. Using Excel to analyze the data, the groups evaluate their...
Curated OER
Sunrise-Sunset
Students gather data, make and share predictions about the time of sunrise ans sunset in their area. Patterns are analyzed and shared with students from other areas.
Curated OER
2 x 2
Students work together to grid a 2 x 2 meter unit using the formula for the Pythagorean Theorem. After creating the grid, they identify the location of artifacts and create a map of their location. They develop a graph and table of their...
Curated OER
Ready, Set, Go!
Students predict if the height of a ramp affect how far an object travels. They design and conduct an experiment to test their predictions. The results are recorded and a graph is created to show the relationship between ramp height and...
Curated OER
Pumped Up Gas Prices
Students calculate gas prices. In this transportation lesson, students tally the mileage and gas costs of their car for one months. They figure out how much was spent on gas and create a graph showing average gas prices over time.
Curated OER
Animal Skin
Young scholars investigate the skin surface to body area ratios for different animals. In this seventh/eighth grade mathematics/science lesson plan, students explore heat transfer between an animal’s body and the environment. Using...
Curated OER
Studying the Equilibrium of a Water System
In this equilibrium instructional activity, students perform a computer simulation on vapor pressure of water at different temperatures to answer 11 problem solving and short answer questions about the topic.
Curated OER
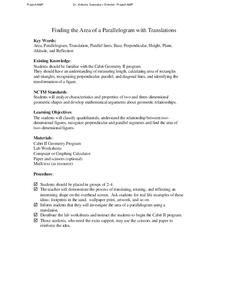
Finding the Area of a Parallelogram with Translations
Learners calculate the area of a parallelogram. In this geometry lesson, students perform translation using a coordinate plane and coordinate pairs. They perform translation on other polygons.
Curated OER
Finding the Area of a Parallelogram with Translations
Students calculate the area of parallelograms. In this geometry lesson, students identify properties of parallelograms and use to to solve problems. They create polygons using Cabri software.
Curated OER
Parabolas Exist Where?
Students recognize how parabolas are used in architecture and calculate a constant of variation.
Center for Math and Science Education
Solar System Launch
Trying to understand the vastness of outer space can be quite a challenge for young scientists. Help put things in perspective with this cross-curricular activity as students work in pairs creating scaled models of the solar system,...
Curated OER
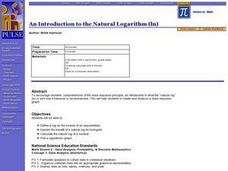
An Introduction to the Natural Logarithm (ln)
Students explore the dose response principle, an introduction to what the "natural log" (ln) is and how it behaves. They create and analyze a dose response graph.
Curated OER
Exponents
Students solve exponential problems using exponential properties. In this algebra instructional activity, students discuss the meaning of exponents, and bases raised to different powers. They explore exponential functions using a computer.
Curated OER
Let's Get Physical
Students collect data using the CBL. In this statistics lesson, students predict the type of graph that will be created based on the type of activity the person does. The graph represents heart rate depending the level of activity.
Curated OER
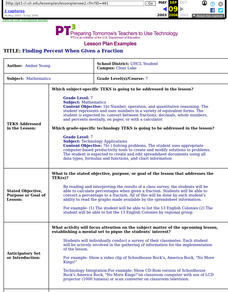
Finding Percent When Given A Fraction
Seventh graders calculate percentages when given a fraction. They convert a percentage to a fraction. All of this be done by each student's ability to read the graphs made available by the spreadsheet information.
Curated OER
The Fuelish Fact Finding
Students define fluctuation and the price of food. In this algebra lesson, students create a budget to live on based on their living expenses. They create a chart and explore the cause and effect of real life scenarios.
Curated OER
Archaeology Vocabulary Sampling
Students predict how many words out of ten they accurately define. They match the definitions to the correct vocabulary words and make a bar graph showing how many definitions were matched to the correct words. The write their group...
Curated OER
Consistent Circles
Students create a design of a circle. In this geometry lesson, students identify the measure of the diameter and radius of a circle. They graph and analyze their collected data and write equations based on direct variation.
Curated OER
Linking Algebra to Temperature
Young scholars convert between two units as they calculate the temperature. For this algebra lesson, students collect data on seasonal climate and create a graph. They make conjectures based on their data collection.
Curated OER
Quadratics: Polynomial Form
Students determine how to use the polynomial form of a quadratic equation to find the location of the vertex on a graph. They determine how changes in the coefficients in a quadratic function affect its vertex on a graph. Students find...


