NOAA
Sediments
Calcareous ooze ... what an interesting name! The 15th installment of a 23-part NOAA Enrichment in Marine sciences and Oceanography (NEMO) program focuses on sediments found on the ocean floor. After viewing the slideshow lecture,...
Science Matters
Earth Shaking Events
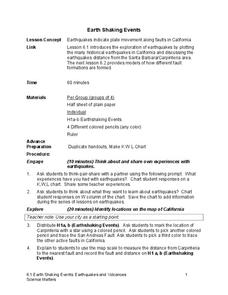
The world's largest measured earthquake happened in 1960 in Chile, reaching a terrifying 9.5 magnitude on the Richter Scale. The second lesson in the 20-part series introduces earthquakes and fault lines. Scholars map where previous...
Curated OER
Kildare, USA: An Environmental Health Simulation
Your biology class plays the role of epidemiologist when a mysterious illness breaks out in Kildare, USA. Using interviews with doctors, patients, and local citizens, maps, the results from different materials sampling, they work to...
It's About Time
Present-Day Climate in Your Community
So what exactly is climate? This first installment of a six-part series introduces the concept of climate using real-world data tables and topographic maps. The timely lesson includes a comprehensive overview of climate, as well as...
Curated OER
Plate Tectonics: Second Grade Lesson Plans and Activities
Second graders explore convection currents and how they relate to the movement of tectonic plates. Then, young geologists reconstruct Pangaea with a worksheet and pinpoint plate boundaries on a map...
Association of Fish and Wildlife Agencies
Schoolyard Biodiversity Investigation Educator Guide
In 1980, in the tropical rainforests of Panama, scientists discovered 1,200 species of beetles living in and around just 19 trees, with most of the species new to science—that's biodiversity! In the activity, learners work in teams to...
Sea World
Endangered Species
Study different endangered species with several activities that incorporate math, science, language arts, and research strategies. A great addition to your lesson on conservation or Earth Day.
National Nanotechnology Infrastructure Network
What’s In Your Neighborhood?
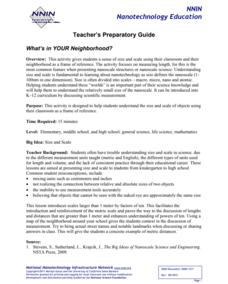
Chart your way to an understanding of nanoscale. Using a Google map, learners estimate a radius around their location of 1,000 and 1,000,000 meters. Predicting what 1,000,000,000 meters would look like takes them off the charts!...
Illinois Department of Natural Resources
Section One: What is Biodiversity?
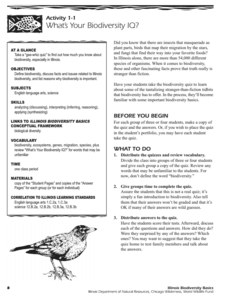
Four intriguing and scientific activities invite learners to explore the natural resources of their town. The activities cover concepts such as genetic traits, organizing species in a taxonomy, the differences between different species...
Curated OER
Unit III: Worksheet 1 - Uniform Acceleration
This concise handout posts a diagram of a block sliding down a ramp. High schoolers draw qualitative graphical representations for displacement vs. time, velocity vs. time, and acceleration vs. time. They draw a motion map and list the...
Alabama Learning Exchange
Mirror, Mirror on the Wall: Reflections of Light
Why can we see our reflection in a window but not a brick wall? Young physicists learn the Law of Reflection and various light properties that help them answer this and other questions about reflection. Use the PowerPoint to introduce...
California Academy of Science
Pollution in Our Watershed
The concept of a how pesticides and other chemicals pass through a watershed can be difficult for younger learners to grasp without a concrete example. In the activity here, some blank paper, markers, and a spray bottle are all you need...
Center for Learning in Action
Density
Explore the concept of density within states of matter—gases, liquids, and solids—through a group experiment in which young scientists test objects' texture, color, weight, size, and ability to sink or float.
Science Matters
A Model of Plate Faults
The San Andreas fault is one of the longest fault zones in the world. In a series of 20 lessons, the fourth lesson has pupils use a paper model to recreate various types of plate faults. Each is held in position then drawn...
Curated OER
Three Dimensional Geology
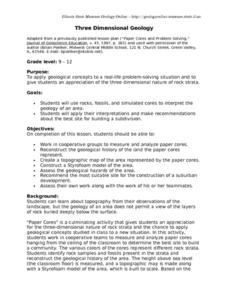
Here is a fine lesson plan on geology designed for high schoolers. Learners use rocks, fossils, and other geological clues to determine the geology of an area. Then, they make recommendations to a fictitious city council about the...
Curated OER
Map your Schoolyard
Students practice their mapping skills by creating an accurate map of their schoolyard using an aerial photo from the National Map web site. Students include legends, a scale, and a north arrow on their maps.
Curated OER
Water Contamination Mapping Lab
Students are introduced briefly to the Biscayne Bay Ecosystem, observed microbe distributions and water current maps are introduced. They measure water current speeds to predict the movement of pollutants based on the type of the tidal...
Curated OER
Ocean Water and Life
In this ocean water and life instructional activity, students match the vocabulary term with the correct definition. Also, students answer questions by deciding if the statements are true or false. Finally, students complete concepts...
Curated OER
Color Enhanced Maps
Students download or create maps with numerical weather data. They add isolines and color to create regions on their maps. They explore the visual properties of color palettes and create a visualization applying their knowledge.
Curated OER
Flatworms
In this biology worksheet, students complete the concept map using the given terms. They fill in 10 blanks with the correct answer.
Curated OER
Catch Your Breath
Seventh graders explore the structure, function, and diseases of the respiratory system. They research basic information about the respiratory system and create a concept map to illustrate it. Students research a disease and create a...
Curated OER
Maps In Our Everyday Lives
Learners break into groups and complete a chart about information on maps of their hometown.
Curated OER
Relief Maps
Students study geographical maps and their functions. In this geography lesson students work in groups to build a map to scale.
Curated OER
What's in the Air?
In this air worksheet, students will choose the correct definition for atmosphere, troposphere, stratosphere, and pollutant. Then students will complete a concept map showing what components make up air. This worksheet has 4 multiple...


