Curated OER
Election Poll, Variation 2
When a random sample isn't enough, your math class can compare the data from a physical simulation to decide if the probability is still likely. The lesson is part of a probability series that focuses on one question and different ways...
Curated OER
Election Poll, Variation 3
Build on probability and incorporate a random number generator to select outcomes for a school election. Your learners will record their results on a dot plot and answer questions regarding whether their candidate has a chance at the...
Curated OER
Vandalism leads to locked bathrooms
Pupils research bathroom vandalism in other schools like Freedom High after reading an article about Freedom High and their situation. Students then decide if their school has a similar problem and interview administrators and janitors...
Curated OER
Career Connections: The Connection Corner
Students will create a career information center. In this careers lesson, students research careers on a local and national level and create a help wanted ad for an occupation of personal interest. Students create a brochure and...
Curated OER
"He Shoots, He Scores": Alcohol Advertising and Sports
Young scholars explore the ways that companies use sporting events to sell products. They show and tell to share what they love about sports. They discuss how advertisers, particulary alcohol advertisers, feature sports figures.
Math Worksheets Land
Patterns of Association (Using Data Table) - Matching Worksheet
This resource is the last of a four-part series that practices calculating percents based on data represetned in tables. This page has four multiple choice problems that analyze the data tables to answer a question.
Curated OER
Data Analysis and Bias
In this probability and statistics instructional activity, students determine when a collected data or a graph of the data could be biased. The one page instructional activity contains four multiple choice questions. Answers are...
Curated OER
Bits and Pieces - More About Percents - Online Manipulatives
In this online percentages worksheet, students access the Library of Virtual Manipulatives web site and open the percentage tool. They use the online tool to complete 8 multi-step questions making graphical representations and finding...
Curated OER
Healthy Food Choices
Students identify healthy food choices. In this nutrition lesson plan, students review the food pyramid and write down their favorite food on a post-it note. Students create a bar graph of favorite foods using the post-it notes.
Curated OER
Write Away
Students examine the effect of computers and other word processing programs have had on traditional forms of communication and expression after reading and discussing the article "Where the Pen is Mightier Than the PC" from The New York...
Curated OER
Graphing Using Excel
Fifth graders complete a series of graphs by gathering information and using Excel to graph the information. In this graphing lesson plan, 5th graders graph favorite desserts of the class. Student put their results into the computer and...
Curated OER
Youth Voter Campaign
Young scholars examine the voting data for the state they where they live. In this voting lesson, students research possible ways to increase the number of people that vote then create a campaign to share an idea of their own with the...
Curated OER
Cloud in the Classroom
Middle schoolers describe the relationship between animals and humans. In this biology lesson, students research about the history of horses in America. They present a mock news broadcast about their research.
Curated OER
That's Entertainment
Second graders view examples of active lifestyles in works of Robert Harris, and list and graph their daily activities to see if they lead active lifestyles. Students then name forms of entertainment that require practice,...
Curated OER
Marketing Research Projects
Students research customer service offerings of a particular business and present their conclusions to the class using PowerPoint and additional visual aids. The guidelines for this lesson can be found through the National DECA.
Curated OER
Beach Burgers
Twelfth graders develop economic literacy of basic economic problems confronting all societies. Economic decision making, scarcity to make choices, economic confronts, market system, prices, demand curves and supply curves are all covered.
Curated OER
The Three Branches of Government
Students write about working in one branch of government. In this branches of government lesson, students read about the three levels of government using various websites and then work in groups to discuss, illustrate and write about...
Curated OER
Auroras! Online Activity
In this auroras instructional activity, students read an online book about auroras and answer short answer questions about it. Students answer 10 questions total.
Curated OER
Water, Water, Everywhere!
Get kids excited about environmental studies with these exciting lesson plans about water!
Curated OER
Improving Students' Math Proficiency
We can help our students improve math proficiency by using a cross-curricular approach and multiple problem-solving techniques.
Discovery Education
Sonar & Echolocation
A well-designed, comprehensive, and attractive slide show supports direct instruction on how sonar and echolocation work. Contained within the slides are links to interactive websites and instructions for using apps on a mobile device to...
Curated OER
The First (and Last) Words
What does "freedom of speech" mean to your class, especially in the context of Internet communications? In round-table discussion format, middle and high schoolers address the issues discussed in "State Legislatures Across U.S. Plan to...
Curated OER
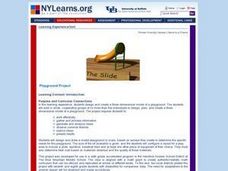
Math: Designing a Playground
Sixth graders design and draw a model playground to scale. They configure the layout to include a sandbox, slide, baseball field and other equipment. Their design includes adaptations for students with disabilities. Their designs are...
National Security Agency
Are You Ready to Call the Guinness Book of Records?
Learners design questions that can be answered by collecting data. In this line-plot lesson, pupils collect data and graph on a line plot on world records. An abundant supply of teacher support is provided in this resource.


