Curated OER
Jack and the Beanstalk Math
Students listen to Jack and the Beanstalk and determine what they think are the most common words. In this Jack and the Beanstalk lesson, students reread the story, count the words they chosen and graph those words. Students graph the...
Curated OER
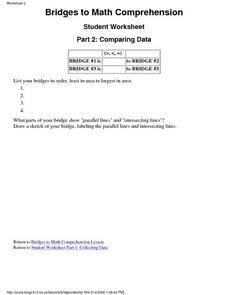
Bridges to Math Comprehension Worksheet 2
In this math literacy worksheet, students compare the data from three different bridges that are constructed. The data is then evaluated and a write up is conducted.
Curated OER
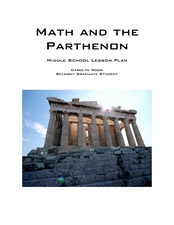
Math and the Parthenon
Students relate math to different areas of construction. In this algebra lesson, students identify the relationship between shapes and the way math is used in architecture. They investigate properties of the Parthenon as it relates to...
Curated OER
Kid Garden Math
Students design a geometric garden. Shapes to be included are squares, triangles, and hexagons. After reading a book together about shapes, students get to use construction paper to cut out and design their own shape garden.
Curated OER
Math: How Many Red M&Ms?
Sixth graders calculate the mean, median, and mode of candy M&Ms and find the percentage of each color. Once they complete the assignment, they compare their results with those of the candy company's percentages. As an extension,...
EngageNY
Describing Center, Variability, and Shape of a Data Distribution from a Graphical Representation
What is the typical length of a yellow perch? Pupils analyze a histogram of lengths for a sample of yellow perch from the Great Lakes. They determine which measures of center and variability are best to use based upon the shape of the...
Curated OER
Multi-dimensional Modeling of Ore Bodies Making Sense of Empirical Data
Math scholars identify four different rock types in that strata and use this identification and data to construct a two dimensional geologic cross-section. They use data tables to construct a three-dimensional geologic cross-section.
EngageNY
Displaying a Data Distribution
Pupils analyze a display of data and review dot plots to make general observations about the highest, lowest, common, and the center of the data. To finish, learners match dot plots to scenarios.
EngageNY
Solving Problems by Finding Equivalent Ratios
Combine total quantities and equivalent ratios in problem solving. The fifth lesson in a series of 29 presents problems that can be solved using equivalent ratios. Pupils use part-to-part ratios and either sums or differences of the...
Curated OER
Flight Path
Young mathematicians investigate that things move in a directional path. They construct a paper airplane and measure an airplane's length of flight. Everyone constructs a map with a key showing their airplane's flight path
University of Utah
Statistics-Investigate Patterns of Association in Bivariate Data
Young mathematicians construct and analyze patterns of association in bivariate data using scatter plots and linear models. The sixth chapter of a 10-part eighth grade workbook series then prompts class members to construct and interpret...
Cornell University
Math Is Malleable?
Learn about polymers while playing with shrinky dinks. Young scholars create a shrinky dink design, bake it, and then record the area, volume, and thickness over time. They model the data using a graph and highlight the key features of...
Curated OER
Something Fishy
Fourth graders complete a variety of activities which are related to fish, and the history of the fishing industry in Canada. This series of lessons incorporates artwork, math, whole-class games, and the construction of an in-class...
Curated OER
Two for One Box Company
Here is a challenging and thought-provoking math learning exercise. In it, learners work together to construct a variety of boxes of different sizes to see if doubling the size of a box really means it can hold twice as much stuff as the...
Curated OER
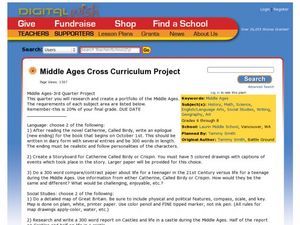
Middle Ages Cross Curriculum Project
Middle schoolers complete several projects on the Middle Ages. In this world history lesson, students complete language arts, social studies, math, and science projects. Some of these include: comparing a teenager's life now to that in...
Curated OER
Discovering Conic Sections in the Motion of Heavenly Bodies
Math scholars study conics and how they are used today. For this mathematical lesson, pupils construct and slice cones after viewing a demonstration.
Beyond Benign
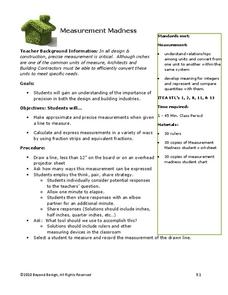
Measurement Madness
Behind all good design and construction lies a perfect set of plans that are created by a person who knows his, or her, math! Youngsters practice using one of the key tools of the draftsman, the ruler, to practice measuring lines to the...
Curated OER
Kindness Castle
Students discuss recognizing when kind deeds are performed. They design and construct a castle-like structure to place notes of appreciation for their classmates. Castles include a dungeon for "grumpy" notes as well. Once castle is...
Curated OER
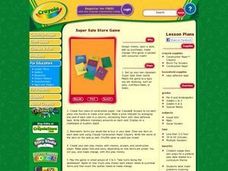
Super Sale Store Game
Students help their teacher set up their classroom in the form of a store. Using construction paper, they make different amounts of paper money and items to buy. To end the lesson, they play the game to practice making change and adding...
Curated OER
What's in a Graph?
How many yellow Skittles® come in a fun-size package? Use candy color data to construct a bar graph and a pie chart. Pupils analyze bar graphs of real-life data on the Texas and Massachusetts populations. As an assessment at the end of...
Curated OER
Comparison of Univariate and Bivariate Data
Learners explore the concept of univariate and bivariate data. In this univaritate and bivariate data lesson, pupils discuss the differences between univariate and bivariate data. They work sample problems where they must construct box...
NY Learns
Investigation - Looking at Polygons
Middle schoolers construct polygons by plotting points on a coordinate plane. Pupils connect the points and identify which polygons they have drawn. They will need graph paper to carry out the assigned activities. A vocabulary list,...
Curated OER
Make a Solar Oven
Students build a solar oven. In this Science lesson, students construct a functional solar oven. Students design the oven and explain the energy concepts involved.
Curated OER
Representing Data 1: Using Frequency Graphs
Here is a lesson that focuses on the use of frequency graphs to identify a range of measures and makes sense of data in a real-world context as well as constructing frequency graphs given information about the mean, median, and range of...
Other popular searches
- Building Construction Math
- Construction Math Triangle
- Math on Construction Workers
- Mathematics in Construction
- Stadia Construction Math
- Staid Construction Math


