Curated OER
Food Type And Calories Per Square Meter
Students compare the efficiency of producing food calories in different types of food then calculate how much land is required to supply their food for a year. They then graph the results.
Curated OER
Differentiating with Daily Math Puzzlers
Young scholars practice word problems based on their own needs and skill levels. In this math word problems lesson, students practice completing one word problem each day until they can move on to the next level.
Curated OER
Oceanography: Ocean Market
Sstudents identify consumer goods obtained from the oceans. They classify the items and calculate the cost of buying these goods. After taking a simulated sea shopping spree, they tally the cost of the items purchased. They conclude the...
Curated OER
What Time Does the Last Worker Report?
Third graders explore the concepts of time and consumer goods. In this telling time instructional activity, 3rd graders respond to questions about the passage of time and goods and services. This instructional activity incorporates the...
Curated OER
Opening your first bank account
High schoolers investigate opening a bank account. In this secondary Consumer Mathematics activity, students read A Guide to Your First Bank Account and take a short quiz on the information.
PLS 3rd Learning
Vehicle Comparison Shopping
This is part of a larger unit on cars (financing, insurance, budget, etc.). Before comparison shopping for their ideal car, teens fill out a survey on their transportation preferences. In related lessons, they consider financing,...
Curated OER
What is the Best Chip?
Scholars collect data about chips. They pick their favorite type of chip from a given variety such as potato chips, tortilla, or banana chips. Then they write on an index card their favorite chip and why it's their favorite. They also...
Beyond Benign
Truckin’ to Your Table
Food takes a trip to the table. Class members choose a meal from a menu and calculate the total cost of the meal including tax and tip. Using a food origin card, pupils determine how far each of the ingredients of a meal traveled to end...
Curated OER
El Salvador: Whose Breakfast Isn't for the Birds?
Sixth graders investigate the understanding of where coffee is grown by conducting a survey. They study the natural history of coffee and examine bird habitats in the areas where coffee is grown. They write letters to explaining the...
Curated OER
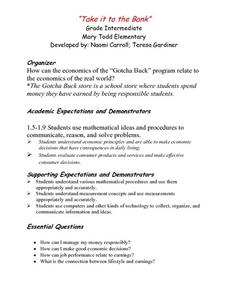
Take It To the Bank
Examine how the economics of a school store relate to real world economics. Elementary students explore various websites, complete a Venn diagram, create a schedule of wages for the students, read the book "A Chair For My Mother" and...
Curated OER
Common Procedure Costs
Kids never think about the cost of medical expenses, because they never think they'll get hurt. To better understand personal financial planning, learners research common medical procedures and their costs. They use a worksheet and the...
PLS 3rd Learning
Reality Check Quiz
After conjuring up images of the ideal lifestyle, young adults are given a reality check. They take an online quiz and complete an activity that requires them to put their dream lifestyle in a real-world context. They determine how...
PLS 3rd Learning
It Costs How Much!?!?
Many teens conjure up images of how great their first apartment will be, but they lack a solid understanding of what it will cost to make it look that way. To gain an appreciation for the cost of furnishings, they create a collage of a...
Kenan Fellows
Let's Move
Find a statistical reason for a fresh start. Using a hypothetical scenario, individuals research statistical data of three different cities. Their goal? Find the best statistical reason for a business to move to a new location. Their...
EngageNY
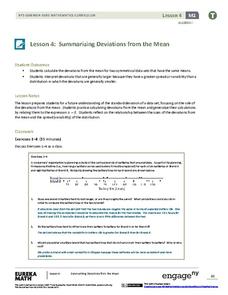
Summarizing Deviations from the Mean
Through a series of problems, learners determine the variability of a data set by looking at the deviations from the mean. Estimating means of larger data sets presented in histograms and providing a way to calculate an estimate round...
Curated OER
How Much Does it Cost to Light Your School?
Learners compute the cost of electricity used to light their classroom and their school for various lengths of time. They compute the amount of coal needed to produce the electricity used for one hour of light in their classroom. An...
Curated OER
Nutrition Lesson Plan
Second graders complete a survey as class answering the question: "Did you eat breakfast this morning?". They place a tally mark in the column that best represents their answer. They then discuss the results in the graph.
Shodor Education Foundation
Playing with Probability
Review basic probability concepts with your class using different-colored marbles in a bag. Then pair up learners and have them play a cool online interactive game in which they race miniature cars using the roll of a die or two. The...
Curated OER
History of Toys and Games
Students research history of popular toys to learn when those toys were first introduced. They use measurement skills to create an accurate timeline.
Curated OER
Swinging Pendulum
Students engage in an activity which demonstrates how potential energy (PE) can be converted to kinetic energy (KE) and back again. Given a pendulum height, students calculate and predict how fast the pendulum will swing by understanding...
Curated OER
Does My hair Disrupt Your Learning?
Students use the internet to research ways to save and earn money. They interview bankers and financial counselors to discover different types of investments. Students create public service announcements to inform their classmates of...
Curated OER
Residential Power System
Perform data analysis on energy consumption to apply algebraic expressions to the real world. Learners will write and solve equations that answer various questions from residential power use. They will collect data at home and calculate...
Curated OER
Using Graphical Displays to Depict Health Trends in America's Youth
Identify the different types of graphs and when they are used. Learners will research a specific health issue facing teens today. They then develop a survey, collect and analyze data and present their findings in class. This is a lesson...
Illustrative Mathematics
The Price of Bread
As part of an initiative to strengthen our young adults' financial understanding, this problem explores the cost of bread and minimum wage since the 1930s. Learners are asked to find the percent increase from each year and compare it...
Other popular searches
- Consumer Math Worksheets
- Consumer Math Projects
- Consumer Math High School
- Consumer Math Activities
- Consumer Math Lessons
- Percentage Consumer Math
- Consumer Math Food
- Consumer Math Simulations
- Consumer Math Using Catalogs
- Money Consumer Math
- Consumer Mathematics
- Consumer Math Projects 40s


