Curated OER
Will There be Enough Water?
Students investigate water usage, water available, and water demand historically in the local area. They use projections of water usage, availability and demand up to the year 2050. Students use graphs to relate as well as compare and...
Curated OER
OTC Medications
Young scholars sort medications by likeness and use. They compare and contrast using a Venn Diagram, and find the differences and commonalities of over the counter and Rx medications.
Curated OER
Candy is Dandy
Students investigate color distribution in bags of M&Ms They sort and classify the contents of a bag of M&Ms and summarize their findings on a worksheet. Students convert the numbers into charts and make predictions about color...
Curated OER
The Fat and the Lean
Students collect data on calorie intake. In this algebra lesson plan, students use the collection of data to make better eating decisions. They investigate the nutritional value in food using a graph and draw conclusion from their findings.
Curated OER
Grocery Shopping and Budgeting
Ninth graders establish a food budget based on individual needs and resources. They evaluate grocery stores and establish guidelines for purchasing specific foods.
Curated OER
Opportunity Cost
Students study what opportunity cost is and why it is important to their lives.
Curated OER
Cost and Revenues
Students develop the key concepts of total, variable, fixed, average and marginal costs. The theory of using different business scenarios is applied to different situations for an extension to real life application.
Curated OER
Probability Lesson Plan
Your learners will examine probability through experiments and dice games. Using a computer, your class will perform simple experiments to collect and analyze data to determine the probability of different experimental results. Young...
Curated OER
Acceptance Sampling
In this algebra activity, students sample food and identify acceptance sampling. They create specific plans to meet specific situations as they sample the food. There are 6 questions.
Curated OER
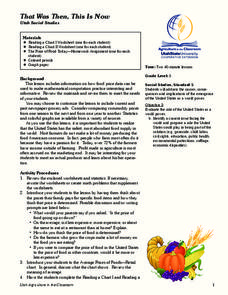
That was Then, This is Now
Students compare and contrast data charts and statistics for food prices of now and in the past. In this food prices lesson plan, students answer short answer questions and calculate computations.
Curated OER
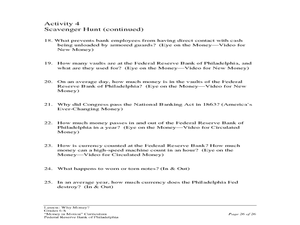
Why Money?
Students participate in a trading simulation to learn about barter and the benefits of using money. In this barter lesson plan, students participate in a trading simulation and learn about coincidence of wants. Students then use money...
Curated OER
99.86% - Measuring Our Sun's Mass
Students determine just how large the sun is. In this solar system lesson, students follow the prescribed steps to draw a box that represents the size of the sun and its mass compared to the entire solar system.
Curated OER
Dressing in Early American Times
Fifth graders, by doing research and seeing actual and simulated artifacts, gain knowledge of and make comparisons about clothing in the Colonial and early Republican eras with attire of present time.
Curated OER
Using the Pythagorean Theorem
Young scholars apply the Pythagorean Theorem to solve real-world problems. They draw diagrams based on written descriptions to calculate the examples.
Curated OER
Making Paper
Pupils make paper from recycled paper. The student estimates, counts, and measures he amount of paper consumed in a classroom daily. They discover that if we use too much paper, it fills up landfills. Some activities they are doing...
Curated OER
Battleship Wisconsin
Students predict what geometric shapes they think would be on the battleship; then view a picture and identify the various shapes they see. They take a tour of the battleship Wisconsin they identify various geometric shapes represented...
Curated OER
Chilly Discoveries
First graders make ice cream and determine what makes this liquid turn into a solid.
Curated OER
Review for the Algebra One SOLs
Students review the standards for Algebra I. Using the text, they discover two problems that match each standard and solve them showing all steps on paper. They create a PowerPoint slide for each problem and go through the correct...
Curated OER
Credit Purchases
Twelfth graders calculate interest on purchases bought with a credit card. They use the formula I=PRT to find the interest. In pairs, they use a flyer to calculate the interest for electronic items.
Curated OER
What Do People Know About Radon?
Students complete a survey about how much they know about radon. They calculate the mean scores for each question and graph them. They discuss the results as a class.
Curated OER
What Do People Know About Radon?
Middle schoolers complete and discuss a radon survery. They calculate the average for each question based on the response. They graph the responses and analyze the information.
Curated OER
ENERGY USE ADDS UP!
High schoolers investigate the amount of power used in your home and what appliances use the most. They analyze the concept that producing energy costs us money, affects our environment and produces waste products. Students come up with...
Curated OER
Bubble Gum Chemistry
Students explore the concept of graphing data. In this graphing data instructional activity, students determine the percentage of sugar in bubble gum. Students graph type of gum vs. sugar percentage. Students create a table of their data.
Curated OER
Kansas vs the U.S.
Students demonstrate an understanding of the physical and political geography of Kansas. They view maps and films to gain knowledge of Kansas. They calculate the percentage Kansas harvests for each crop out of the national total.


