Mathematics Vision Project
Quadratic Equations
Through a variety of physical and theoretical situations, learners are led through the development of some of the deepest concepts in high school mathematics. Complex numbers, the fundamental theorem of algebra and rational exponents...
Curated OER
Russian Dolls Investigation
Students measure a set of Russian dolls using the metric system. In this measurement lesson plan, students identify certain relationships between sets of measurements by measuring a set of Russian dolls and presenting their findings to...
Noyce Foundation
Time to Get Clean
It's assessment time! Determine your young mathematicians' understanding of elapsed time with this brief, five-question quiz.
Noyce Foundation
Pizza Crusts
Enough stuffed crust to go around. Pupils calculate the area and perimeter of a variety of pizza shapes, including rectangular and circular. Individuals design rectangular pizzas with a given area to maximize the amount of crust and do...
Ohio Department of Education
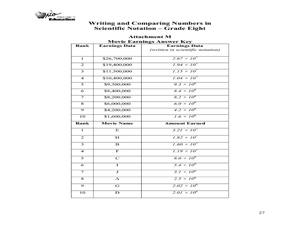
Writing and Comparing Numbers in Scientific Notation-Grade Eight
Explore scientific notation in this mathematics lesson plan. Young mathematicians explore multiple representations of large number in scientific notation through the use of models, visual representation and expanded form. The lesson plan...
Curated OER
Measuring Temperature and the Production of CO2 in Yeast
Students use a model experiment to complete an experiment on yeast. In groups, they identify the independent and dependent variables and use the scientific method to complete the activity. They record their observations and discuss them...
Curated OER
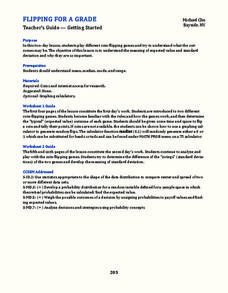
Flipping for a Grade
What happens when your teachers get tired of grading tests and want to use games of chance to determine your grade? How would you decide which game they should play? Learn how to use expected value and standard notation to compare two...
Noyce Foundation
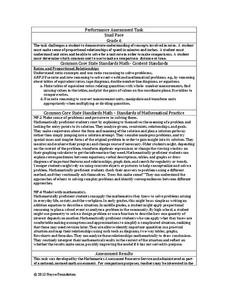
Snail Pace
Slow and steady wins the race? In the assessment task, scholars calculate the rates at which different snails travel in order to find the fastest snail. Hopefully, your class will move much more quickly in finishing the task!
Curated OER
Munching Mice
Students examine different variables and their effects on weight gain in mice. They consider the validity of relating the results in mice to humans.Finally, they discuss the ethics of using animals in experiments.
Curated OER
Not Just a Bag of Beans
Learners determine the types of natural selection and variation that exists in a population, using beans.
Curated OER
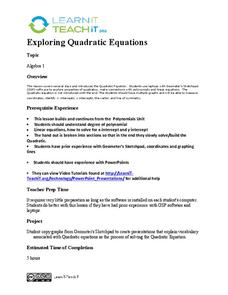
Exploring Quadratic Equations
Eleventh graders explore quadratic equations. In this Algebra II lesson plan, 11th graders use Geometer’s Sketchpad to explore the properties of quadratics and the connections with polynomials and linear equations. The lesson plan is...
Curated OER
Aruba Cloud Cover Measured by Satellite
Students analyze cloud cover and to compose written conclusions to a given related scenario. They submit a letter of response and a report detailing their calculations and conclusions.
Curated OER
The Water Cycle
Seventh graders discover how water circulates through the earth and its atmosphere while determine how much of the Earth's water is suitable for drinking. They discover the meaning of evaporation, transpiration, and precipitation and...
Curated OER
Microsoft Publisher Country Brochure
Students explore geographic information. In this geography and technology lesson, students choose a county and answer related questions on a Webquest. Students create a word web and design a country brochure.
Curated OER
Food in History
Students research, predict and offer solutions regarding factors that affect current or future food crops could result in economic, political or social changes.
Curated OER
Gwynns Falls
Students investigate the question: What is the impact of urban development and expansion on the health of a decidious forest ecosystem and humans? They examine the issue of land development by responding to a specific scenario and...
University of Illinois
University of Illinois: Data Types
The University of Illinois provides this site that is helpful because of the various kinds of data that can be collected. This lesson plan helps students differentiate between qualitative, quantitative, and many other types of data.
CK-12 Foundation
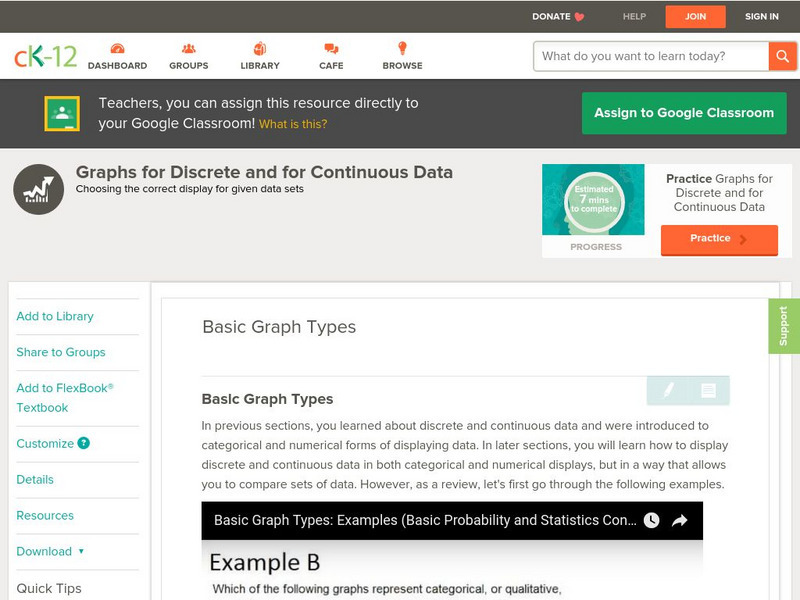
Ck 12: Basic Graph Types
[Free Registration/Login may be required to access all resource tools.] Students will review the different types of graphs, and the differences between discrete and continuous data, and between qualitative and quantitative data. They...
CK-12 Foundation
Ck 12: Statistics: Basic Graph Types
[Free Registration/Login may be required to access all resource tools.] Organize distributions of data by using a number of different methods.
Texas Instruments
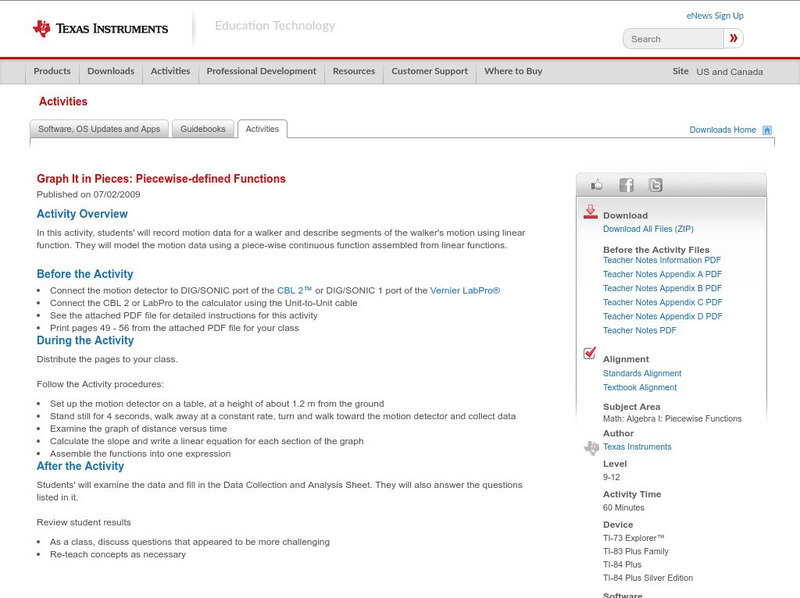
Texas Instruments: Graph It in Pieces: Piecewise Defined Functions
In this activity, students' will record motion data for a walker and describe segments of the walker's motion using linear function. They will model the motion data using a piece-wise continuous function assembled from linear functions.
CK-12 Foundation
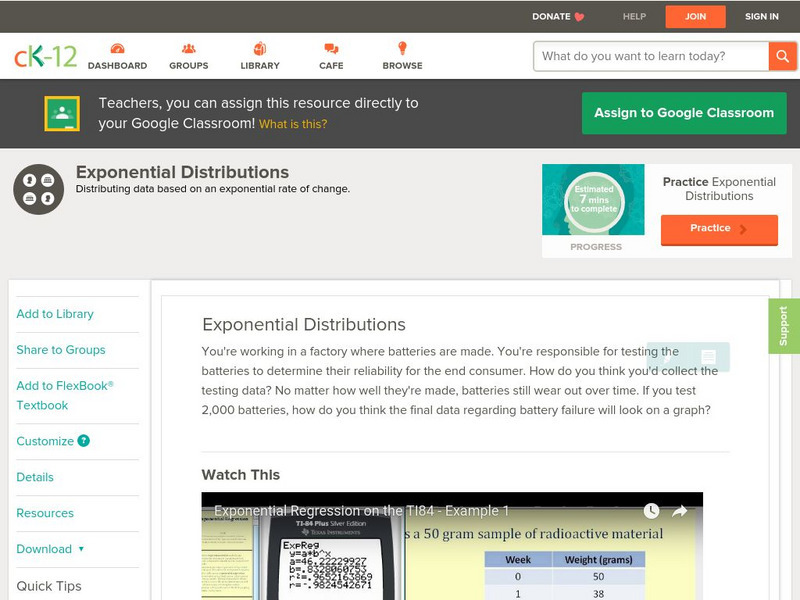
Ck 12: Probability: Exponential Distributions
[Free Registration/Login may be required to access all resource tools.] Covers exponential distributions. Presents examples using a graphing calculator as well as guided and independent practice questions.
Texas Instruments
Texas Instruments: Modeling Exponential Decay With a Look at Asymptotes
Students use sample data to approximate models with the Transformation Graphing Application. They are introduced to the idea of discrete data sets being used with continuous function models. They also identify non-zero asymptote form of...
TeachEngineering
Teach Engineering: Dams
Through eight lessons, students are introduced to many facets of dams, including their basic components, the common types (all designed to resist strong forces), their primary benefits (electricity generation, water supply, flood...


