Curated OER
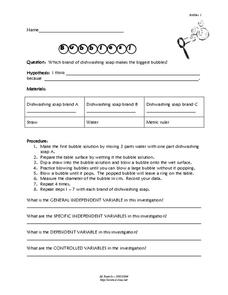
Bubbles
Young scholars experiment bubbles. In this scientific method lesson, students identify variables used in proper experiment design. Young scholars conduct experiments with different brands of dish-washing detergent to determine which...
Curated OER
Seed Growth
Students develop an independent procedure to investigate the germination of two types of seeds. Students must construct data tables or charts to record observations and results, graph the data, and analyze the data.
Curated OER
Make a Pass at Me
Students identify different types of functions and units of measurements. In this statistics lesson, students will collect data, graph their data and make predictions about their data. They plot a linear regression graph.
Curated OER
Diffusion
Students design and carry out an experiment according to the scientific method. The experiment must test the effects of time and concentration on the rate of diffusion of potassium permanganate into potato cubes. After performing the...
Curated OER
Freshman Project-Part 6-Final Written Report
In this project worksheet, students complete a formal write up of their experiments. This includes a rationale, a purpose, a hypothesis, their experimental design, materials, procedure, data tables with variables, graphs and a concluding...
Curated OER
Epidemiology: Graphing and Analyzing Health Data
Students graph data on fetal and infant mortality rates collected by the Centers for Disease Control and Prevention. They identify trends in the data and propose potential causes for the trends.
American Chemical Society
Evaporation
This is one in several lessons that explore the relationship between temperature and phase changes of water. After some discussion, elementary physical scientists place wet paper toweling on a hot and a room-temperature water bag and...
Curated OER
Rules of the Roll
Students roll a ball down a plank and measure the distance it travels. Students graph the distances the ball travels as they change the height of the incline (increase slope).
Curated OER
What's in the Water? - Stream Side Science
Here is a complete activity in which young biologists or ecologists test the pH, dissolved oxygen, turbidity and temperature of stream water. The class visits an actual stream and makes observations of the site. They use scientific...
Curated OER
Wetland vs. Stream Macroinvertebrates
A link to a comprehensive macroinvertebrate guide gives you the information needed to prepare for this field study activity. Sample macroinvertebrates are collected from areas representing different environmental conditions. Junior...
Curated OER
Solar Kit Lesson #11 - Power Maximum: An Electrical Determination
Collaborative groups connect resistors and solar panels in series and measure electrical resistance, voltage, and current. The objective is to order 16 solar panels from strongest to weakest. They graph current-voltage and power curves...
Curated OER
Where do Plants Get their Food?
In this where do plants get their food worksheet, students design an experiment that will disprove the idea that plants obtain their food from soil. Students will set up their experiment and design a data table that will record data over...
Curated OER
Middle Grades Math: Balancing Equations
Learners solve linear equations. By observing the graph of each side of an equation using the TI-nspire graphing calculator, your class gains insight into solutions, as well as balancing equations and transforming linear equations....
Curated OER
Exploring Expressions
Examine parts of an expression in this algebra lesson plan. Ninth graders identify the properties of the coefficient and their behavior to the graph. They graph the equation on a TI to see their results.
Curated OER
Does The Type of Mulch Used Affect Plant Growth?
Students measure, record and graph the plants they grow in a controlled setting. They feed and water the plants as needed and use the scientific method to evaluate the growth.
Curated OER
Coefficient of Restitution
Students investigate variables that influence the bouncing of balls. In this exploratory instructional activity students observe how the manipulated and control variable are correlated by graphing the data.
Curated OER
The Atlatl System
Fifth graders are introduced to the atlatl system and how to test and control variables. In groups, they use the Internet to research how the system has changed over time. They test various variables and record their results in a graph...
Curated OER
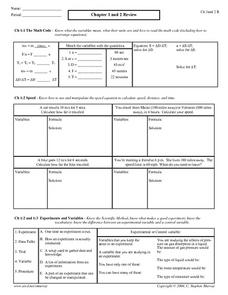
Chapter 1 and 2 Review
In this physics review worksheet, students complete 24 matching and problem solving questions pertaining to math code, speed, experiments and variables, slope, and acceleration and average speed.
Curated OER
Marble Madness
Middle schoolers determine the velocity of a marble rolling down the incline. In this physics lesson plan, students identify the independent and dependent variables in the experiment. They construct and analyze a graph.
Curated OER
Which Tape is Stickiest?
Students conduct an experiment to determine which style of tape will stick the best. In this controlled experiment lesson, students predict which tape will stick best to a marble that rolls over it, then they conduct the experiment and...
Curated OER
Quadratic Relation and Parabola
Students identify the vertex and intercepts of a parabola. In this algebra lesson, students graph parabolas and factor quadratic equations. They perform transformation on the parabolas.
Curated OER
Using Graphs to Compare
Students use the FoilSim computer simulation program, and demonstrate an understanding of the lift variables by explaining their graphical representations. They demonstrate an understanding of forces and motion.
Curated OER
Graphing Your Motion-Day 1
Ninth graders explore the concepts of motion, velocity and acceleration through graphing their own movement using LoggerPro. They become more familiar with the computer technology. Students explore graphing in real time and graph on...
CK-12 Foundation
Stow Lake
Does the depth of a pond matter to the waves created when rain is falling? Many people assume the answer is no, but interestingly, it does matter. Pupils explore this concept and other variables related to wave behavior through a...


