Curated OER
Batting the Unknown
Students use batting averages to provide a measure of a player's past success. They use Algebra to calculate required performance to improve the average. Students compare baseball batting statistics early in the season and late in the...
Curated OER
Fraction to Percent
In this fraction worksheet, 6th graders convert the given fractions into percentages. Students solve for six problems, some having mixed numbers and answers greater than 100 percent.
Curated OER
Kinzi Deaf Alumni
Pupils use data of school alumni to create a database. The lesson uses technology and access to a computer lab is essential. The concepts of graphing statistics is also used to help teach across the curriculum.
Curated OER
Handling Data: Representing Date - Online Version
Here is an online lesson plan on data representation. In it, learners access websites embedded in the plan which lead them through a variety of activities around data representation and statistics. The activities are quite good, and...
Curated OER
Percent To Fractions
In this math worksheet, students convert the percents to fractional equivalents through the reading of the percentage as a decimal or division.
Curated OER
Changing Fractions to Percents
In this fractions to percents worksheet, students solve 6 problems, converting fractions given to percentages. Students may click on hint or check answer buttons.
Curated OER
Hot Shots 2
Students simplify fractions. They convert fractions to decimals. Students comprehend the double number line and how to use it proportionately. They convert fractions to percentages using the double number line. Students use the...
Curated OER
Free Cell
Fourth graders use algebra to begin solving a problem. The problem has a real world application to engage learners. The main skill is converting fractions and decimals. Also finding the right number sentence for the word problem is...
Curated OER
Probability
Eighth graders relate real life events with probability. In this probability lesson, 8th graders investigate using coin toss, discuss NBA shooting percentages and MLB batting averages. Students also complete a worksheet.
Curated OER
Capacity Lotto
In this mathematical worksheet, learners convert fifteen metric units of capacity and multiply and divide whole numbers by 10, 100 and 1000.
Curated OER
Fra-Per-Dec
Students explore the concept of ordering fractions and finding equivalent fractions. In this ordering fractions and finding equivalent fractions lesson, students play a card game where students must collect 5 cards with equivalent...
Curated OER
Percent
In this percents worksheet, students solve 10 fill in the blank problems where they are given a fraction and must express each fraction as a percent.
Curated OER
Percent
In this percents worksheet, students solve 10 fill in the blank problems where they are given a fraction and must express each fraction as a percent.
Curated OER
World Education Statistics
Students use a spreadsheet from The Digest of Education Statistics and convert the statistics to percentages, and create a chart of their new data. Students discuss their findings about the disparities in educational spending among...
Science Geek
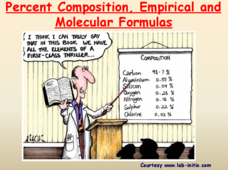
Percent Composition, Empirical and Molecular Formulas
Help your pupils understand when empirical becomes molecular. The lesson presentation demonstrates the connection between empirical formulas and molecular formulas. Then, given percent composition, the lesson demonstrates the steps to...
Curated OER
Are You 100%?
Students use decimals, fractions, and percents to solve problems in a real world setting.
Curated OER
Home Sales Records
Teach your class how to calculate monthly payments on a home mortgage. In this percent lesson, students calculate the monthly payment on a home mortgage, and compare different lengths of time and the interest rates for national median...
Curated OER
Find the Mystery Lines...If You Can!
In this atomic spectral lines worksheet, students observe a diagram of the spectral lines, their different wavelengths and their intensity. They solve 4 problems which include interpreting the scale, matching up tabulated lines with the...
Curated OER
M&M's Candies Worksheet Graph
In this graphing worksheet students will record data on a bar graph. Students will take a bag of M&M's and chart the colors they find inside this bag.
Curated OER
Graph Lab
Seventh graders explore bar graphs and pie charts. Given a pack of M&Ms, 7th graders explore the colors, sort the data in a frequency chart and then construct bar graphs and pie charts to categorize the M&Ms by color. Students...
Curated OER
Grasping Graphs
In this grasping graphs worksheet, students solve and complete 3 different types of problems. First, they graph the data described and select the appropriate graph type. Then, students identify the independent and dependent variable. In...
Curated OER
How does Your Province Stack Up?
Students investigate data about age, and sex of a population. In this statistics lesson, students are given data on a population to analyze and compare to other provinces. This assignment is part of a geography lesson and requires 3...
Curated OER
Making Circle Graphs
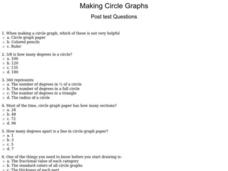
In this circle graphs worksheet, students answer multiple choice questions about how to make circle graphs. Students answer 10 questions total.
Curated OER
Graph Both Crusts
Fourth graders calculate the angles and construct a pie graph of the percentages of the elements in the continental and oceanic crusts. Then they analyze the results. They can be assigned the task of researching the percentages.


