Curated OER
A Tall Story
Students investigate the growth rate of a man named Bob Wadlow. In this growth rate of a man lesson, students determine if the growth rate of this particular man was normal or abnormal. Students bring in data of their height...
Curated OER
A Recipe for Reading: Asian Style Rice and Eggs
Learners read, write about, and cook with rice in this home economics lesson. They reflect on the experience eating rice at home or in other ethnic foods.
Curated OER
Heat and Heat Technology
In this science worksheet, students complete the exercises that focus on the concept of heat and the use of a thermometer. The sheet also requires prior knowledge of using a telephone.
Curated OER
A Wet Welcome Home
Learners investigate data collection and analysis. In this Algebra I activity, students create a scatter plot and find the equation of best fit in a simulation of a leaking water pipe.
Curated OER
Equations with one Variable II
In this single variable equations worksheet, students solve 5 problems using different equations to solve for one unknown. They use Hubble's Law to find the velocity of a galaxy knowing the distance it travels.
Curated OER
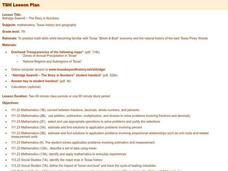
Aldridge Sawmill - The Story in Numbers
Seventh graders practice math skills while becoming familiar with Texas' "Boom & Bust" economy and the natural history of the east Texas Piney Woods. They utilize worksheets and websites imbedded in this plan.
Curated OER
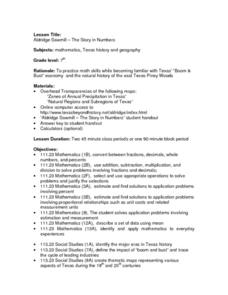
Aldridge Sawmill - The Story in Numbers
Seventh graders view overhead maps of Texas, explore history of Aldrige Sawmill, and practice math skills while becoming familiar with Texas' "Boom & Bust" economy and natural history of east Texas Piney Woods.
Curated OER
Aldridge Sawmill -- The Story in Numbers
Seventh graders view a recent transparency of the average rainfall zones of the state of Texas. Using another transparency, they identify the Piney Woods subregion of the Gulf Coastal Plain and locate national forests and sawmills. ...
Curated OER
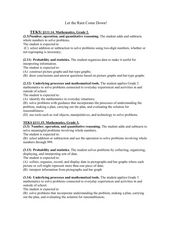
Let the Rain Come Down!
Second graders construct a bar graph comparing local precipitation to that of the Yucatan. In this graphing lesson, 2nd graders will use conversions and problem solving strategies.
Curated OER
Estimating Volumes Of Household Containers
Students engage in a the estimation of volume for household containers and focus upon the usage of the metric system. They practice identifying the shapes that seem familiar and match shapes with quantities. Students interact with others...
Curated OER
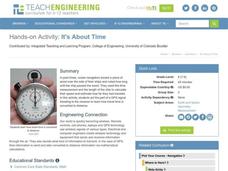
It's About Time
Students investigate how Global Positioning Systems work and how and why GPS receivers make errors. They graph data points and apply estimation and prediction to real-life GPS situations, discuss time delay, and complete a worksheet.
Curated OER
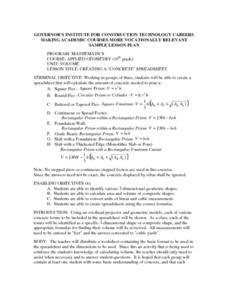
Creating a "Concrete" Spreadsheet
Students create a spreadsheet that calculate the amount of concrete needed to pour various concrete forms.
Curated OER
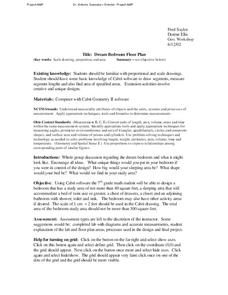
Dream Bedroom Floor Plan
Students build and apply concepts of geometry. In this geometry lesson, students create a building using proportions and scale drawings. They use Cabri technology to create a virtual drawing first.
Curated OER
Problem Solving with Multiplication and Division
For this multiplication and division worksheet, students answer multiplication and division problems where they use charts and solve word problems. Students complete 10 problems total.
Curated OER
Problem Solving with Multiplication and Division
In this problem solving with multiplication and division worksheet, students interactively answer 10 multiple choice questions, then click to check their answers.
Curated OER
Perimeter
Learners explore the concept of perimeter. In this perimeter lesson plan, students discuss how to find perimeter of various shapes. Learners use the Perimeter Explorer applet to find the perimeter of various shapes.
Curated OER
Use Scientific Method to Solve Problems
Students are given a set problem, they use the scientific method to solve the problem using all steps of the scientific research. Students list the steps of the scientific method used in solving a problem. They are given a selected...
Curated OER
Plastic Packaging
Students collect data. In this math lesson, students collect data about recyclable materials. Students develop a plan that will help the environment. Recycling plastic containers is discussed.
Curated OER
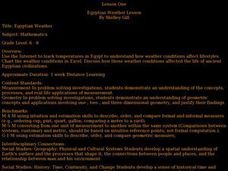
Egyptian Weather Lesson
Students chart temperatures in Egypt on spreadsheet to determine how weather conditions affect lifestyles.
Curated OER
Tally Time
Students create a tally chart. In this math and health lesson, students discuss healthy foods and create a tally chart showing the number of students who like to eat healthy foods.
Curated OER
Reading Trees: Understanding Dendrochronology
Students examine tree-ring dating and discuss the lack of water the settlers in Jamestown faced. They create paper tree rings, simulate rain patterns, and describe the history of construction paper tree sequences.
Curated OER
Science Quiz-Electricity
In this science electricity quiz, students answer a set of 10 questions.Page contains links to additional activities and answers.
Curated OER
Salinity
Learners define and discuss salinity, conduct classroom experiment to determine salinity of water sample by using hydrometer, record predictions, and demonstrate understanding of how salinity influences object's ability to float in water.
Curated OER
What are the Odds
Students predict the-outcome of an event. For this algebra lesson, students compare and contrast the probability of an event occurring. They calculate the odds of a simple event and make estimation.


