Curated OER
Living on the Edge
Young scholars calculate the volume of polyhedrons. In this algebra lesson, students are asked to solve a complex problem. They identify the length of the edges and the volume of the shape.
Curated OER
Watch Your P' and Q's
Pupils solve polynomial functions by graphing. They factor rational expressions to find the roots of the equation and apply the rational zero theorem to find the zeros of a polynomial.
Curated OER
Permutations & Combinations
Young mathematicianss predict the outcome of an event. Learners solve problems using permutations and combinations. They use the TI calculator to see the different combinations and how the groupings occur.
Curated OER
Permutations
Learn how to solve the probability that an event will occur. Learners also employ permutations and combinations to find the amount of time it takes for an event to occur. They use the Ti to create a visual of the events.
Curated OER
Temperature and Thermal Energy
For this temperature worksheet, students answer 8 questions about temperature and thermal energy. For example, "What term refers to an energy transfer that causes a change in temperature?"
Curated OER
Integration By Substitution
Young scholars calculate the solution using integrals in this calculus lesson. They use the TI to create a visual of how to compute integrals. Learners also use substitution by integration and all its properties.
Curated OER
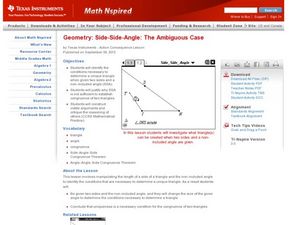
The Ambiguous Case
Students investigate the relationship of triangles with its sides and angles. In this geometry lesson, students create visual on the graphing navigator as they study triangles. They move the sides around to create different angle-side...
Curated OER
Falling Objects
High schoolers examine the velocities of two different falling objects. They produce distance vs. time and velocity vs. time graphs using a Motion Detector and a CBL 2 to collect experimental data. Learners analyze and interpret the...
Texas Instruments
Data Collection for Bar Graphs
Learners study the concept of central tendency in this data collection for bar graph lesson. They collect data outside as instructed and organize it into a bar graphs, then they list in specific groups the labels that appear on the...
Curated OER
Graphing Systems at the Races
Learners investigate systems of equations as they use the Ti-Navigator to explore scenarios about dog races and NASCAR races. Pupils determine the winner of the race and when opponents pass each other given a speed and distance.
Curated OER
Evaluation Expressions
High schoolers explore algebraic expressions in this Algebra I lesson. They evaluate expressions using paper and pencil and then use the TI-83 to provide immediate reinforcements.
Curated OER
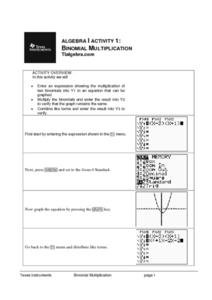
Binomial Multiplication
Learners explore binomial multiplication through the use of technology. Using a graphing calculator, you pupils enter the binomial expression into Y1, multiply the binomials and enter that result into Y2, and combine like terms and enter...
Curated OER
Guess the Ages
Learners explore scatter plots in this algebra lesson. They create a scatter plot from their guesses regarding a famous person’s birth date and the actual birth date then they examine and interpret the results of their graph.
Curated OER
Approximation of Pi
Students explore the concept of Pi. For this Pi lesson, students measure the circumference and diameter of a circle. Students record the diameter and circumference measurements from their classmates. Students enter the data into lists...
Curated OER
Connecting Factors and Zeros
In this Algebra II lesson, learners explore the connection between the factored form of a quadratics and the zero of a function. Students use a graphing calculator to verify factoring numerically and graphically.
Curated OER
Volumes of Rectangular Prisms
High schoolers determine the volume of a rectangular prism. They then maximize and minimize the volume given variable side lengths. Finally, they factor the volume equation to determine the side lengths.
Curated OER
Geometric Sequences and Series
Learn to calculate the nth term of a sequence defined by an algebraic expression. They examine geometric sequences and series, relate geometric sequences to their explicit forms, find the partial sums of a sequence in a table, and...
Curated OER
Name That Tune: Matching Musical Tones Through Waveform Analysis
Pupils detect the waveform of musical notes to determine the code for the "safe" in this forensics simulation lesson. They use a microphone and tuning forks along with Vernier EasyData on their graphing calculator to analyze five musical...
Curated OER
Approaching Limits
With the assistance of their Ti-84/Ti-83 Plus calculators, students develop a foundation for the limiting process as well as estimate limits from graphs and tables of values. They view how a function behaves as the input approaches a...
Curated OER
Average Rate of Change, Difference Quotients, and Approximate Instantaneous Rate of Change
Pupils, with the assistance of their TI-84 Plus / TI-83 Plus calculators, distinguish meanings from right, left and symmetric difference quotients that include rate of change and graphical interpretations. They utilize symmetric...
Curated OER
Investigation the Derivatives of Some Common Functions
High schoolers investigate the derivative of a function. In this calculus lesson, students explore the derivatives of sine, cosine, natural log, and natural exponential functions. The lesson promotes the idea of the derivative as a...
Curated OER
Divisibility Rules Using Scientific Calculators
Young learners apply divisibility rules to determine if a number is a factor of another number. They discuss what numbers are factors of another number and identify patterns using divisibility rules.
Curated OER
Measuring Angles
Middle schoolers explore angle measure as they estimate angle measure and measure and draw angles of less than 360 degrees. The lesson emphasizes the use of estimation when measuring angles.
Curated OER
Let's Gather Around the Circle
Scholars explore the relationship between circumference and diameter. Groups of learners measure the diameter and circumference of round objects and record their data on a given worksheet. They then input the data into their graphing...
Other popular searches
- Chocolate Chip Cookies
- Baking Cookies
- M&m Cookies
- Compare and Contrast Cookies
- Cookies Renewable Resources
- Fortune Cookies
- Making Cookies
- Cookies Sequence of Events
- Decorating Cookies
- Rock Cookies
- Baking Cookies Sequencing
- Making Gingerbread Cookies


