Curated OER
Exploring Graphs
Students are introduced to connecting graphing in a coordinate plane to making scatterplots on a graphing calculator. Working in pairs, they connect points plotted to make a sailboat and complete questions on a worksheet as well as plot...
Curated OER
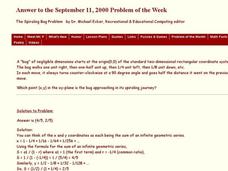
The Spiraling Bug Problem
In this algebra worksheet, students analyze the journey of a bug as it moves along a coordinate plane at a 90 degree angle. There is an answer key with problem.
Curated OER
Properties of Reflections
Students perform transformation on their polygons. In this geometry lesson, students identify the correct transformation of each shape. They move the polygons around on a coordinate plane. There are extension and homework activities...
Curated OER
Carbon Monoxide and Population Density
Tenth graders investigate the carbon monoxide level at a fixed latitude to determine if there is a relationship to population density. They download data sets and generate a graph, and find locations using the Earth's coordinate system....
Curated OER
Distance Formula
Students watch teacher demonstration of distance formula, view non-collinear cities on maps, plot points on coordinate plane, evaluate square roots, compute distance between two points, and use Heron's formula to find area of triangles.
Curated OER
Density Phenomena-Using the Concept of Density
Students investigate the concept of density by observing demonstrations. In this density lesson plan, students make observations while the teacher demonstrates the Cartesian diver, a density column, a candle trough, a wave bottle, an...
Curated OER
Up, Down, Right, Left - Function Families
Students explore quadratic functions. In this function family worksheet, students examine the quadratic function and the family of functions. They identify the affects of the shape of the parabola and its position on the coordinate...
Curated OER
Perpendicular and Angle Bisectors
In this geometry worksheet, 10th graders solve problems that are based on the theorems associated with perpendicular and angle bisectors of a triangle. An application on the coordinate plane is included. The one page worksheet contains...
Curated OER
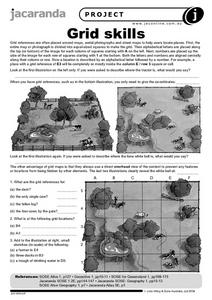
Grid Skills
In this geography activity, students use grid references on a map to locate places in the pictures given. They also identify another advantage of using a grid map, which they have an overhead view of the content to prevent any features...
Curated OER
Graphing From Function Tables
In this graphing from function tables worksheet, students graph given functions from a completed function table. This is a worksheet generator, the teacher can set the grid size for plotting points as well as whether or not to include a...
Curated OER
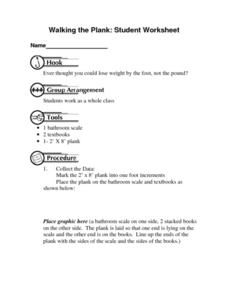
Walking the Plank: Student Worksheet
In this math worksheet, students will work in a group to experiment with the weight of objects when placed at a distance from a scale (using a plank). Students will record and graph their results.
Curated OER
Analytic Geometry
In this analytic geometry worksheet, 9th graders graph and solve 13 different types of problems that include determining whether equations are linear to matching given equations to their corresponding equation in the second column....
Curated OER
Graphs & Equations of Lines
In this graphs and equations of lines worksheet, 10th graders solve 12 different problems that include graphs and various equations of lines. First, they determine the slope of a line that passes through two sets of points. Then,...
Curated OER
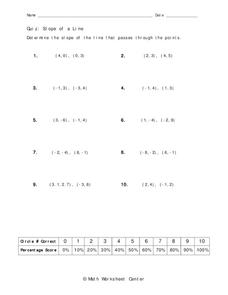
Slope of a Line
In this slope of a line worksheet, students solve 10 different problems that include determining the slope of a line that passes through the given points. First, they use the slope formula by placing each of the points in the correct...
Curated OER
Finding Equations From Graphs
In this equations from graphs worksheet, 9th graders solve and graph 10 different problems that include determining the actual equation for each. First, they determine the slope and y-intercept for each graph shown on the right. Then,...
Curated OER
Graphing Systems of Inequalities
In this graphing systems of inequalities worksheet, 9th graders solve and complete 8 different problems. First, they solve each inequality if necessary. Then, students graph each inequality to locate the overlapping portions on the grid....
Curated OER
1st Geometry
In this geometry worksheet, students choose the multiple choice answer to 15 questions involving several different elements of geometry.
Curated OER
Worksheet 38
For this math worksheet, students investigate different types of functions and coordinate systems. They review that when integrating a function over a region in the plane using polar coordinates, a “magical” factor of r appears in the...
Curated OER
Condiment Diver: The World's Simplest Cartesian Diver
Students examine buoyancy. In this density lesson students form a hypothesis, collect data and draw a conclusion using the data.
Mathematics Assessment Project
Square
Don't be a square! Young mathematicians determine the slope and length of a line segment. They then prove whether four given coordinate points form a square.
Houghton Mifflin Harcourt
Unit 4 Math Vocabulary Cards (Grade 6)
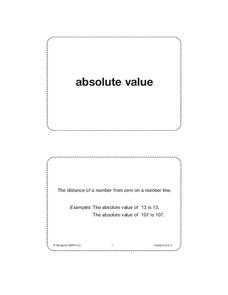
Reinforce math vocabulary with a set of flash cards. Forty-eight cards offer boldly printed words, and their corresponding definition alongside an example with labels. Terms include absolute value, inverse operations, slope, and more!
EngageNY
Mid-Module Assessment Task: Grade 8 Module 3
How well does the class understand dilations? The three-part assessment presents problems related to the properties of dilations. Pupils perform dilations and determine whether a dilation is responsible for a specific image.
EngageNY
End-of-Module Assessment Task - Grade 8 Mathematics (Module 3)
Everything the class knows about similarity in one small package. The last portion of a 16-part series is a three-question assessment. In it, pupils demonstrate their application of similar figures and their associated transformations.
Shodor Education Foundation
Two Variable Function Pump
Use a function to operate on two variables. Pupils look at operating with complex numbers as a function of two variables. The interactive squares the input and adds a constant to it. Learners visualize the resulting output and its...
Other popular searches
- Coordinate Graphing Pictures
- Coordinate Graphing
- Holiday Coordinate Graphing
- Coordinate Graphs
- Blank Coordinate Graphs
- Coordinate Picture Graphs
- Graphing Coordinate Planes
- Coordinate Graphs Art
- Turkey Coordinate Graphs
- Cartesian Graph
- Coordinate Graphing Worksheets
- Coordinate Graphs Pictures


