Curated OER
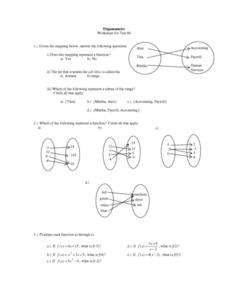
Trigonometry: Worksheet for Test #4
In this trigonometry worksheet, students determine whether given mappings are functions. They evaluate 5 functions for a given x value. Students graph 2 functions. They determine which ordered pairs are solutions to given functions....
Curated OER
Tables and Linear Graphs
In this tables and linear graphs worksheet, students examine linear functions. They solve equations and graph them on a coordinate plane. This four-page worksheet contains 8 multi-step problems. Answers are provided on the last page.
Curated OER
Geometry: Translations and Reflections
Group work and participation is used to perform a specified translation or reflection. In this geometrical translation activity, small groups of pupils are each given a shape to plot on a coordinate grid. Each shape is then translated or...
Curated OER
Find Parabolas through Two Points
Your learners will write quadratic functions whose graphs include specific points and explore how these graphs are related to each other.
Curated OER
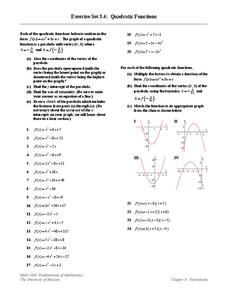
Quadratic Functions
In this graphing quadratic equations worksheet, young scholars find the vertex and graph the parabola for 24 quadratic equations. The final four are factored into binomials to increase accuracy of the x intercepts.
Curated OER
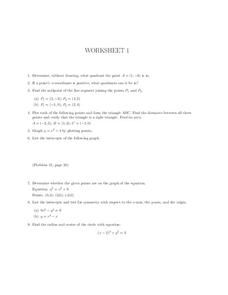
Worksheet 1, Coordinate Graphing
In this algebra worksheet, students determine the quadrant a given point is in. They find the midpoints of two line segments. Students plot points to form a triangle and find the distance between points. Students find the area of the...
Curated OER
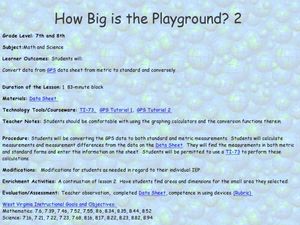
How Big Is The Playground?
Students calculate the standard and metric measurements of a playground. In this measurement instructional activity, students use GPS coordinates and graphing calculators to determine the dimensions of an area outside of the school in...
Curated OER
MAP Practice
In this geometry activity, students create circle, line and bar graphs using different comparisons of events. There are 24 questions with an answer key.
Mathematics Vision Project
Modeling Data
Is there a better way to display data to analyze it? Pupils represent data in a variety of ways using number lines, coordinate graphs, and tables. They determine that certain displays work with different types of data and use two-way...
Curated OER
A Sum of Functions
Collaborative learners will see the geometric addition of functions by graphing the sum of two graphed curves on the same coordinate plane. This task then naturally flows into giving learners the algebraic representation of the curves...
Scholastic
Study Jams! Ordered Pairs
Using an amusing amusement park, Sam describes how it is a coordinate plane and how to graph an ordered pair. Perfect for beginners, the animation moves on to point out a tip using the first quadrant of an empty coordinate plane.
Curated OER
Pre-Calculus Review Sheet
Pre-Calculus has some detailed formulas involved and here is a great resource that lumps then all together for you. Broken up into rectangular, polar, and parametric sections, the conics all include formulas and graphs.
K20 LEARN
Airplanes and Airstrips, Part 2
Table the decision to land. Pupils form flight crews by matching up different representations of linear equations. Given a set of coordinates for an airstrip, the crews determine the equation of the line that will position their planes...
College Board
2007 AP® Calculus BC Free-Response Questions
Provide a review for the exam so individuals don't tank. AP® provides the free-response questions for teachers to use to help their pupils prepare for the exam. The six BC questions from 2007 include regions bounded by functions, water...
Curated OER
Graphs, Three-Dimensional Coordinates
For this three-dimensional graphing worksheet students identify the coordinates of the vertex of shown figures. The first three shapes show all answers. The following 8 shapes are on coordinate dot paper, with all three axis shown and...
Curated OER
Algebra/Geometry Institute Summer 2007: Graphing Activity
Seventh graders practice identifying coordinates by examining a city map. In this graphing lesson plan, 7th graders create coordinate directions on an index card and practice locating these locations on a grid. Students read and...
Curated OER
Proportionality in Tables, Graphs, and Equations
Students create different methods to analyze their data. In this algebra lesson, students differentiate between proportion and non-proportional graph. They use the TI-Navigator to create the graphs and move them around to make their...
Curated OER
Determine the Coordinate of Transformations
Young scholars investigate transformation on a coordinate plane. In this geometry lesson, students identify pairs of coordinates and their location on the grid. They perform rotation and reflection of each polygon.
Curated OER
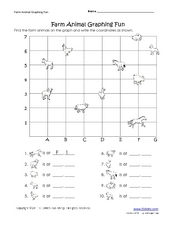
Farm Animal Graphing
In this farm animal graphing worksheet, learners locate farm animals on a graph and rite the coordinates for each, 10 total. An answer key is given on page 2.
Curated OER
Graphing Integers
Fifth graders complete an integer graphing activity. In this integer graphing lesson, 5th graders use coordinate grids to help them complete linear functions and integer graphing.
Curated OER
Graphing Linear Equations Using the Table Method
Young scholars graph linear equations using a table. For this algebra lesson, students create a table of values using the linear equation to find the y-values. They plot their point on a coordinate plane and graph the line.
Curated OER
Polar Coordinates Game
In this algebra game, students pair off to plot polar coordinates on a circular graph. They attempt to hit each other by guessing their opponents location on the graph. This is a great way to reinforce the concept of polar coordinates....
Curated OER
Proofs in Coordinate Geometry
In this coordinate geometry worksheet, students identify the lengths of a quadrilateral and find the slope of a line. They use proofs to identify the characteristics of given quadrilaterals. This one-page worksheet contains ten problems.
Curated OER
Graphing Inequalities and Shading
Students graph and shade inequalities. In this algebra lesson, students graph inequalities using the slope-intercept form. They shade the side of the line that is the solution and identify the domain and range.
Other popular searches
- Coordinate Graphing Pictures
- Holiday Coordinate Graphing
- Graphing Coordinate Planes
- Coordinate Graphing Worksheets
- Cartesian Graphing Pictures
- Coordinate Graphing Art
- Using Coordinate Graphing
- Coordinate Graphing Practice
- Algebra Coordinate Graphing
- Coordinate Graphing Distance
- Graphing Coordinate Pairs
- Graphing on a Coordinate Grid


