Curated OER
Constructing and Solving Linear Equations
Students solve linear equations In this algebra instructional activity, students create linear equations using integer coefficients greater than one. They graph their solution on a coordinate plane.
Curated OER
The Bigger they Are . . .
Students do a variety of data analyses of real-life basketball statistics from the NBA. They chart and graph rebounding, scoring, shot blocking and steals data which are gathered from the newspaper sports section.
Curated OER
Comparison of Two Different Gender Sports Teams - Part 3 of 3 Scatter Plots and Lines of Best Fit
Students create a scatter plot for bivariate data and find the trend line to describe the correlation for the sports teams. In this scatter plot lesson, students analyze data, make predictions,and use observations about sports data...
Curated OER
I Spy
Students take photos of objects and write an equation. In this equations with photos lesson, students take pictures of objects around the school that have the shape of mathematical items learned in class. Students also draw in an x-axis...
Curated OER
R & R - Incorporating Literature While Teaching Math - Ordered Pairs - "The Polar Express"
Third graders create pictures using ordered pairs after listening to a piece of literature. In this ordered pairs and literature lesson, student listen to and discuss The Polar Express by Chris Van Allsburg. They participate in...
Curated OER
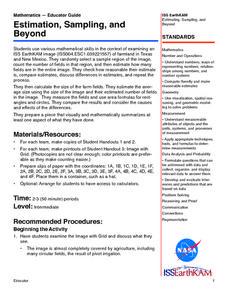
Estimation, Sampling, and Beyond
Students examine an ISS EarthKAM image of farm land in Texas and New Mexico. They select sample region of image and count the number of fields in that region. They estimate how many fields are in the entire region.
Curated OER
Location, Location, Location: Using a Grid to Determine Context
Seventh graders are introduced to making inferences about artifacts. Using a grid system, they locate the artifacts and determine where they originated from. They use this information to make conclusions about the way people lived...
Curated OER
Mathematics Within: Algebraic Patterns
Pupils discover patterns in linear equations by playing a dice game to collect data. They graph the data and analyze the patterns of the lines created by the data. The class then compares the individual graphs to evaluate the position of...
Curated OER
Constellations
Students explore constellations. They read trade books about constellations and write notes including their locations, origins, and names. They research and report on one constellation in the Northern Hemisphere and share their report...
Curated OER
Corps of Discovery
Middle schoolers assess their knowledge of the Corps of Discovery through a written pretest, follow the journey of Lewis and Clark on the internet, record data on events, dates, places, people, animals, distance traveled, and geographic...
Curated OER
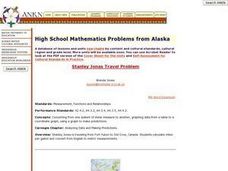
High School Mathematics Problems from Alaska: Stanley Jonas Travel Problem
Students convert from one system of linear measure to another, graphing data from a table to a coordinate graph, using a graph to make predictions.
Curated OER
Transformations
Seventh graders complete activities to perform transformations of various figures and describe the transformations. For this transformations lesson, 7th graders perform a translation, a rotation, and a reflection on graph paper. Students...
Curated OER
Transformations
Tenth graders recognize, perform and derive rules for basic transformations including translation, reflection and rotation. They also consider compositions, a combination of two or more basic transformations. Students explore both...
Curated OER
The Unit Circle
Students relate the trigonometric functions to the coordinates of the unit circle. They classify trigonometric functions as odd or even. Students determine the signs of trigonometric functions in each quadrant. They are explained that...
Curated OER
"Ball Bounce" Quadratic Functions
Young scholars manipulate a ball and explore quadratic functions. In this algebra lesson, learners analyze the graph of a quadratic function. They identify quadratic properties.
Curated OER
Cracks on the Walls
Students observe the cracks in school walls and pavements. In this geometry lesson, students explore the factors to be considered before building a structure. They complete a graphing and calculation worksheet after the lesson.
Curated OER
Linear Progression
Students use graphing calculators to graph lines and create tables of values. They perform an experiment using M&M's and slinkys, then create their tables based on their results.
Curated OER
Points in a Complex Plane -- Lecture
Students review plotting points on a coordinate plane. Individually, they add and subtrace complex numbers and graph them in a complex plane. They follow along a worksheet while their teacher lectures on the new material and solve...
Curated OER
Quadratics: vertex form
Learners practice graphing quadratic equations to find the vertex of quadratic functions. They determine if the graph opens upward or downward as well as convert quadratic equations to vertex form from polynomial form. A lab version is...
Curated OER
Quadratics: Vertex Form
High schoolers practice graphing quadratic equations. They work to solve and equation involving finding the vertex using given formulas. Once their points have been graphed, students determine the direction in which the angle opens....
Curated OER
Bungee M&M's
Eighth graders experiment with M&M's and a cup attached to a spring to to simulate a bungee jump. They graph the results of the experiment and make predictions for continuing the experiment. They determine the "line of best fit."
Curated OER
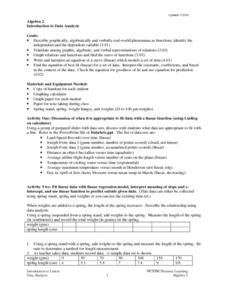
Introduction To Data Analysis
Seventh graders investigate the concept of looking at the data put in a variety of ways that could include graphs or data sets. They analyze data critically in order to formulate some sound conclusions based on real data. Students graph...
Curated OER
Hyperbolas
Students find the center, foci, vertices, and asymptotes of hyperbolas. They graph hyperbolas and determine the equation of a hyperbola with a horizontal transverse axis. They derive general coordinates for the foci of a hyperbola with a...
Curated OER
Cutting Cordwood
High schoolers examine a story problem in which two men are earning money by cutting cords of wood. They use data from graphs to use on a grid. They practice writing algebraic equations as well.
Other popular searches
- Coordinate Graphing Pictures
- Holiday Coordinate Graphing
- Graphing Coordinate Planes
- Coordinate Graphing Worksheets
- Cartesian Graphing Pictures
- Coordinate Graphing Art
- Using Coordinate Graphing
- Coordinate Graphing Practice
- Algebra Coordinate Graphing
- Coordinate Graphing Distance
- Graphing Coordinate Pairs
- Graphing on a Coordinate Grid


