Curated OER
Graphing Linear Equations
Use this graphing worksheet to have learners evaluate and graph linear equations. A coordinate plane, for graphing, is provided below each equation. This one-page worksheet contains seven problems.
Curated OER
Visualizing Vectors
Investigate vectors in standard positions and use the CellSheet application on the TI calculator to find the sum of two vectors. Convert from polar to rectangular coordinates and vice versa, and show graphs of the vectors.
Curated OER
The Order of Things on a Coordinate Grid
Students are able to identify ordered pairs on coordinate plane, and graph points on a coordinate plane. They are able to write an ordered pair for each of the points on a graph, and create a design or picture using ordered pairs.
Curated OER
Geometry: Helix-a-Graph
Students use geometry to create art. In this geometric graphing and patterns lesson, students create a helix-a-graph by plotting points on a grid that follow a certain pattern and analyze the drawing they created.
EngageNY
Vectors in the Coordinate Plane
Examine the meaning and purpose of vectors. Use the lesson to teach your classes how find the magnitude of a vector and what it represents graphically. Your pupils will also combine vectors to find a resultant vector and interpret its...
Museum of Tolerance
Why is This True?
Are wages based on race? On gender? Class members research wages for workers according to race and gender, create graphs and charts of their data, and compute differences by percentages. They then share their findings with adults and...
Curated OER
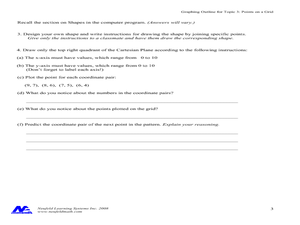
Concept: Points on a Grid
In this coordinate grid graphing worksheet, students play a game of Battleship on the computer. They answer 21 questions about the coordinate grid and graphing.
Curated OER
Let's Plot Points
Use coordinate grid paper to plot points and identify shapes that are already plotted on the paper by saying their coordinates. Pupils also measure the distance between points and play the game Battleship. There are several web links and...
Curated OER
Slope, Vectors, and Wind Pressure
A hands-on lesson using the TI-CBR Motion Detector to provide information to graph and analyze. The class uses this information to calculate the slope of motion graphs and differentiate scalar and vector quantities. There is a real-world...
Curated OER
Mathematics Module
Delve into graphing! The concepts covered begin with basic graphing basic coordinates and algebraic expressions on coordinate planes, and build up to graphing linear inequalities and equations. Learners solve and simplify various...
Curated OER
Speed
Fifth and sixth graders practice working in pairs to determine whether they can walk with constant speed. They test themselves, collect their data, draw graphs with their data collected, manipulate the data, and then draw conclusions...
Curated OER
Stars and Slopes
More of a math lesson plan than physics or space science, high schoolers take a set of data and plot it on a log-log coordinate system. The write-up for day two was never completed, but day one, "Stars and Slopes," is complex and...
Curated OER
Point Reflection
Use this task as an exit ticket for your eight graders during the geometry unit. All they need to do is identify the coordinates of a point reflected over y=2000.
Texas Instruments
Complex Numbers: Plotting and Polar Form
Explore the concept of, and use the Ti-Nspire to, convert complex numbers into polar form. Then practice graphing complex numbers in the polar coordinate plane.
Curated OER
Walk-A-Thon
Students graph linear http://www.lessonplanet.com/review?id=180542equations. In this problem solving lesson, students calculate slope and plot ordered pairs on a coordinate grid. Using a real-life example of a walk-a-thon, students...
Curated OER
Systems of Equations and Inequalities
This is a comprehensive lesson on creating and solving equations and systems of equations and inequalities. Problems range from basic linear equations to more complex systems of equations and inequalities based on a real-world examples....
Illustrative Mathematics
Chocolate Bar Sales
In this real-world example, algebra learners start to get a sense of how to represent the relationship between two variables in different ways. They start by looking at a partial table of values that define a linear relationship. They...
Curated OER
Profitable Soda Stand
Am I making any money? Help learners determine if their fictitious soda stand is turning a profit. They graph linear equations using the slope and y-intercept and identify the best price to use to sell soda. They identify the domain and...
Curated OER
Barbie Bungee
Middle and high schoolers collect and analyze their data. In this statistics lesson, pupils analyze graphs for linear regression as they discuss the relationship of the function to the number of rubber bands and the distance of the...
Curated OER
Graphing Candy-Coated Chocolates
Students place pieces of candy on their coordinate graphs as the teacher calls out the colors and coordinates embedded in the plan. The teacher circulates around the class to check each student's answers for accuracy.
Curated OER
Compound Inequalities and Graphing
Put geometry skills to the test! Learners solve compound inequalities and then graph the inequalities on a coordinate plane using their geometric skills. They identify the slope and y-intercept in order to graph correctly. I like this...
Curated OER
Graphing Systems of Inequalities
Solve equations and graph systems of inequalities. Designed as a instructional activity to reinforce these concepts, learners revisit shading and boundaries along with solving linear inequalities.
Curated OER
Exercise Set 2.7: Functions and Graphs
In this functions worksheet, students solve 40 short answer problems. Students determine if a graph represents a function. Students find the domain of absolute value and square root functions.
Illustrative Mathematics
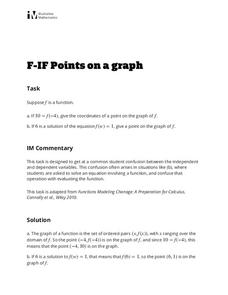
Points on a Graph
Learners practice using their knowledge of how to interpret a function and use function notation. The activity includes two questions. Given an input of a function and its output, the first question asks learners to write the ordered...
Other popular searches
- Coordinate Graphing Pictures
- Holiday Coordinate Graphing
- Graphing Coordinate Planes
- Coordinate Graphing Worksheets
- Cartesian Graphing Pictures
- Coordinate Graphing Art
- Using Coordinate Graphing
- Coordinate Graphing Practice
- Algebra Coordinate Graphing
- Coordinate Graphing Distance
- Graphing Coordinate Pairs
- Graphing on a Coordinate Grid


