Curated OER
Graphing Linear Functions
Seventh graders identify the use of a function.They are asked to describe the input and output of a function. Students also identify different aspects of the coordinate system and represent functions in a visual graph.
Curated OER
Interpreting Graphs
Pupils investigate graphs. In this graphing lesson, students create a graph regarding the population of California. Pupils extrapolate answers concerning the data set.
Curated OER
Graphing on a Coordinate Grid
Young scholars work in groups to create a graph on a coordinate grid. In this graphing lesson plan, students analyze data and put it into their graph by plotting points.
Curated OER
Variables and Patterns: Determining an appropriate scale while graphing
Sixth graders determine appropriate scales when graphing data. In this graphing lesson plan, 6th graders use an the applet "Graph It" to determine what is an appropriate scale for their data.
Curated OER
Graphing Linear Equations
In this linear equations worksheet, students graph linear equations on a coordinate plane. They identify the slope and the y-intercept. This five-page worksheet contains approximately 36 problems.
Curated OER
Straight Line Graphs
Students review the techniques of plotting and reading points on a grid. They identify why facts explaining how to read coordinates as well as the importance of the order in which the coordinates are given. Individual practice of...
Curated OER
Extra Practice 16: Graphs of Quadratic Functions
In this graphing worksheet, students determine the domain and graph quadratic functions. Coordinate planes are provided below each function. There are 36 problems on this four-page worksheet.
Curated OER
Graphing Linear Equations
In this graphing worksheet, pupils graph linear equations. Coordinate planes are provided for each equation. There are 16 equations on this two-page worksheets.
Curated OER
Extra Practice 48: Graphing Exponential and Logarithmic Functions
In this graphing worksheet, students graph exponential and logarithmic functions. A coordinate plane is provided for each problem. Eighteen problems are on this two-page worksheet.
Curated OER
The Coordinate Plane
Students engage in a instructional activity that is about the concept of graphing using the coordinate plane. They view a PowerPoint presentation and practice solving different problems. Students discuss vocabulary words with the help of...
Curated OER
Locating Points Using Cartesian Coordinates
Pupils discover coordinates as they explore Chicago. In this math lesson plan, students give the coordinates of a point, plot a point, and use the coordinate system in locating places on a map.
Curated OER
Cartesian Baseball
Students are told what a coordinate system is and also that it provides a way of uniquely describing each point on a plane or in space. They are given a practice problem along with the equation. Students solve the following problem:...
Curated OER
A Second View of Polar Coordinates
In this polar coordinates worksheets, students change ordered pairs from rectangular form to polar form. They plot and label points and identify alternative coordinate pairs for given points. There are approximately 20 problems on this...
Curated OER
Olympic Line Graphs
Sixth graders examine how to make line graphs. In this Olympic line graph lesson students make line graphs and search the given Internet sites to find data on their summer Olympic Game.
Curated OER
Graphing Linear Equations with Calculator
Students graph lines using the calculator. In this algebra lesson, students graph lines of equations in the form y=mx+b. They input equations into the TI Calculator and graph using the slope and intercept. They analyze the graph for...
Curated OER
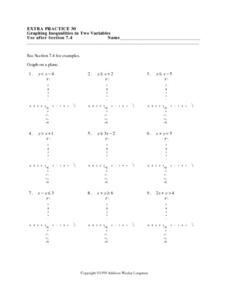
Graphing Inequalities in Two Variables: Extra Practice 30
In this math worksheet, students graph inequalities on a coordinate grid. The eight problems have a coefficient of one for the y variable. Three problems have a negative value for y. The final four problems are horizontal or vertical lines.
Curated OER
Operations and Coordinates: The Coordinate System
Middle schoolers play a "Battleship" type of game to practice graphing on a coordinate grid. In this graphing lesson, students listen as the teacher explains quadrants and ordered pairs. They place their "ships" on the board. The teacher...
Curated OER
Transforming Snoopy Using Coordinates
Students graph coordinate points to create a picture of Snoopy. In this coordinate point lesson, students read a book and learn about Rene Descartes' invention, the coordinate grid. Students graph a surprise picture on...
Curated OER
Graphing Linear Equations
Ninth graders review the information that they have already learned
with regard to linear equations and graphical representations. They then assist in combining equations with a graphical element and complete various graphs with this...
Curated OER
More graphing situations by making a table
Students make a table and graph plotting points. In this algebra lesson, students graph linear equations on a coordinate plane. They calculate the rate of change and analyze the graph for extrapolation.
Curated OER
Worksheet 25
In this math worksheet, students draw a graph of functions on a polar graphing system. They graph two functions by first plotting them on the vertical axis as a function of a given angle, then by plotting them at a radial distance from...
Curated OER
Ellipses and Kepler's First Law
The class examines graphs in the form r = F(¿¿) in polar coordinates (r, ¿¿), in particular with the circle, ellipse and other conic sections. They determine the nature of an ellipse by studying the role of the semimajor axis and...
Curated OER
Worksheet 38-Spring 1996
In this math worksheet, students determine if the definite integral of given functions exist. They use a Taylor polynomial to approximate given values. Students express the arc length of a graph on a polar coordinate system as an integral.
Curated OER
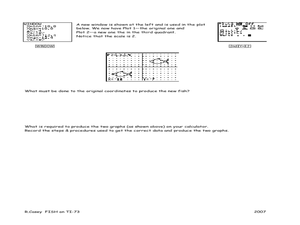
Fishing for Points
Learners explore the concept of ordered pairs. In this ordered pairs lesson, pupils list the ordered pairs of a graph in the shape of a fish. They use their calculator to translate the fish using lists, then translate the fish left,...
Other popular searches
- Coordinate Graphing Pictures
- Holiday Coordinate Graphing
- Graphing Coordinate Planes
- Coordinate Graphing Worksheets
- Cartesian Graphing Pictures
- Coordinate Graphing Art
- Using Coordinate Graphing
- Coordinate Graphing Practice
- Algebra Coordinate Graphing
- Coordinate Graphing Distance
- Graphing Coordinate Pairs
- Graphing on a Coordinate Grid


