Curated OER
Graphing Functions With 2 Points and From a Graph
Learners plot points on a coordinate plane. They describe, in words, methods for finding the slope of a line. After given a worksheet, students read instructions, draw a Cartesian plane, plot ordered pairs, and graph lines. Papers are...
Virginia Department of Education
Rotation
Rotate this resource into your lesson plans. Scholars rotate polygons in the coordinate plane by multiples of 90 degrees. They then compare the original and new figures to develop conjectures about coordinate points after rotations.
Curated OER
Cartesian Coordinates
Students investigate rational numbers through data analysis and statistics. In this algebra lesson, students represent, rename, compare and order rational numbers. They collect and represent data correctly on a graph.
Curated OER
Geometry: Translations and Reflections
Group work and participation is used to perform a specified translation or reflection. In this geometrical translation lesson, small groups of pupils are each given a shape to plot on a coordinate grid. Each shape is then translated or...
Curated OER
Find Parabolas through Two Points
Your learners will write quadratic functions whose graphs include specific points and explore how these graphs are related to each other.
Curated OER
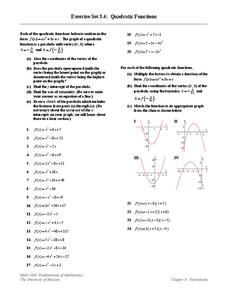
Quadratic Functions
In this graphing quadratic equations worksheet, learners find the vertex and graph the parabola for 24 quadratic equations. The final four are factored into binomials to increase accuracy of the x intercepts.
Curated OER
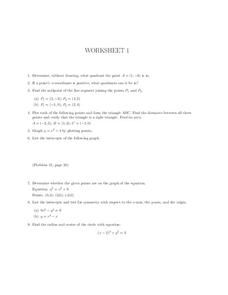
Worksheet 1, Coordinate Graphing
In this algebra worksheet, students determine the quadrant a given point is in. They find the midpoints of two line segments. Students plot points to form a triangle and find the distance between points. Students find the area of the...
Curated OER
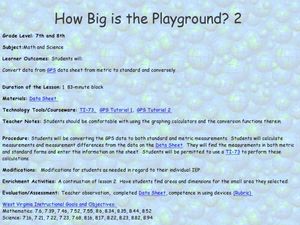
How Big Is The Playground?
Students calculate the standard and metric measurements of a playground. In this measurement instructional activity, students use GPS coordinates and graphing calculators to determine the dimensions of an area outside of the school in...
Curated OER
A Sum of Functions
Collaborative learners will see the geometric addition of functions by graphing the sum of two graphed curves on the same coordinate plane. This task then naturally flows into giving learners the algebraic representation of the curves...
K20 LEARN
Airplanes and Airstrips, Part 2
Table the decision to land. Pupils form flight crews by matching up different representations of linear equations. Given a set of coordinates for an airstrip, the crews determine the equation of the line that will position their planes...
Curated OER
Algebra/Geometry Institute Summer 2007: Graphing Activity
Seventh graders practice identifying coordinates by examining a city map. In this graphing lesson plan, 7th graders create coordinate directions on an index card and practice locating these locations on a grid. Students read...
Curated OER
Proportionality in Tables, Graphs, and Equations
Young scholars create different methods to analyze their data. For this algebra lesson, students differentiate between proportion and non-proportional graph. They use the TI-Navigator to create the graphs and move them around to make...
Curated OER
Determine the Coordinate of Transformations
Students investigate transformation on a coordinate plane. In this geometry lesson, students identify pairs of coordinates and their location on the grid. They perform rotation and reflection of each polygon.
Curated OER
Graphing Integers
Fifth graders complete an integer graphing activity. In this integer graphing lesson, 5th graders use coordinate grids to help them complete linear functions and integer graphing.
Curated OER
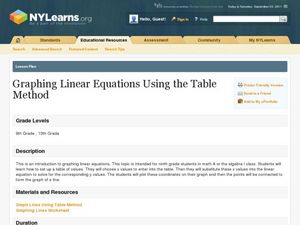
Graphing Linear Equations Using the Table Method
Students graph linear equations using a table. In this algebra lesson plan, students create a table of values using the linear equation to find the y-values. They plot their point on a coordinate plane and graph the line.
Curated OER
Graphing Inequalities and Shading
Students graph and shade inequalities. In this algebra lesson, students graph inequalities using the slope-intercept form. They shade the side of the line that is the solution and identify the domain and range.
Curated OER
Graphing Parabolas and Circles
Students graph parabolas and circles. In this algebra lesson, students create a table of values and graph the coordinate pairs to create a graph. They graph a circle using the radius and center.
Curated OER
Investigating Linear Equations Using Graphing Calculator
Students investigate linear equations using the Ti-Calculator. In this algebra lesson, students graph lines and identify the different quadrants on a coordinate plane. They identify ordered pairs used to plot lines.
Curated OER
More Graphing With Intercepts
In this graphing worksheet, students graph linear equations. They identify the x or y-intercept. Coordinate planes are available below each equation. Nine problems are provided on this two-page worksheet.
Curated OER
Graphing Integers
Fifth graders explore the math concept of graphing integers. In this graphing integers lesson, 5th graders examine visual examples. Students also practice solving problems that their instructors model.
Curated OER
Battle Shapes
Fifth graders play Battleshapes which is a variation of Battleship with geometry. In this geometry lesson, 5th graders get a graph paper with four quadrants. They call out coordinate points and attempt to sink their opponents shapes.
Curated OER
Transforming Triangles
Sixth graders graph translations (slides) and reflections (flips) on a coordinate plane. They visualize and identify geometric shapes after applying transformations on a coordinate plane. Finally, 6th graders write a paragraph telling...
Curated OER
Functions and the Vertical Line Test
Students examine functions and function notation. They use computer activities to discover how to graph functions, and conduct a vertical line test. Students describe spatial relationships using coordinate geometry.
Curated OER
Comparing Costs
Students compare the costs of two cellular phone plans and determine the best rate. They use a table and a graph of points plotted on a Cartesian plane to display their findings. Students write an equation containing variables that could...
Other popular searches
- Coordinate Graphing Pictures
- Holiday Coordinate Graphing
- Graphing Coordinate Planes
- Coordinate Graphing Worksheets
- Cartesian Graphing Pictures
- Coordinate Graphing Art
- Using Coordinate Graphing
- Coordinate Graphing Practice
- Algebra Coordinate Graphing
- Coordinate Graphing Distance
- Graphing Coordinate Pairs
- Graphing on a Coordinate Grid


