Curated OER
Writing and Graphing Functions
Students explore mathematics by completing a graphing assignment in class. In this math functions lesson, students practice graphing X and Y coordinates on a graph and checking their work with partners. Students complete more graphing...
Curated OER
Applications of Properties of Quadrilaterals in the Coordinate Plane
High schoolers explore the concept of quadrilaterals. In this quadrilaterals lesson, students use the slope formula, midpoint formula, and distance formula to justify that a given quadrilateral is a parallelogram.
Curated OER
Impossible Graphs
Students distinguish between possible and impossible graphs of functions, and to learn why some graphs are impossible. They have practiced plotting functions on the Cartesian coordinate plane
Curated OER
Pet Count Excel Graphing
Learners used collected data to distinguish what pets they have or would like to have. They correlate findings with appropriate technology--Excel. At the end of the lesson they tabulate a bar chart and present their findings to the class.
Curated OER
Algebra 1, Unit 7, Lesson 8: Practice Finding the Equation of a Line
Students solve systems of linear equations by graphing. The introduction of the lesson asks students to work in pairs or small groups to graph a line when given two points. Students graph 14 equations on the same coordinate grid to...
Illustrative Mathematics
Introduction to Linear Functions
Introduce your algebra learners to linear and quadratic functions. Learners compare the differences and relate them back to the equations and graphs. Lead your class to discussions on the properties of a function or a constant slope...
EngageNY
Writing the Equation for a Circle
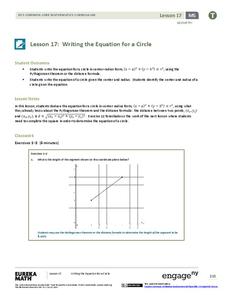
Circles aren't functions, so how is it possible to write the equation for a circle? Pupils first develop the equation of a circle through application of the Pythagorean Theorem. The lesson then provides an exercise set for learners to...
Curated OER
Art Class, Variation 1
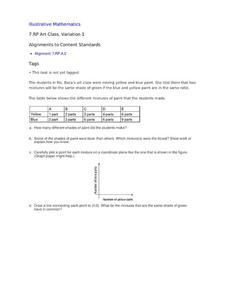
Student statisticians calculate ratios to determine how many shades of green were mixed by Ms. Baca's art class. They graph the number of blue parts against the number of yellow parts for each combination and discover that some produce...
Curated OER
Interactivate - Lines, Rays, Line Segments, and Planes
Pupils explore lines, rays, line segments, and planes. In this math instructional activity, students discuss the math concepts and direct their instructor in graphing functions. Pupils collaborate in graphing additional functions.
Curated OER
Plotting Points
Eighth graders practice plotting points on a coordinate plane. As a class, they create and label the parts of a graph. Given ordered pairs, they plot the points, connect them to reveal a particular shape, and find the area of the shape.
Curated OER
Data
Students collect data from an experiment they perform. In this data activity, students use multiple representations to solve practical problems; describe advantages and disadvantages of the use of each representation. Then, they evaluate...
Georgia Department of Education
The Basketball Star
Have learners use math to prove they are sports stars! Assess a pupil's ability to create and analyze data using a variety of graphs. The class will be motivated by the association of math and basketball data.
Curated OER
Graphing Review
Students review the principles of graphing linear functions. They discuss plotting points on a coordinate plane, solving using a table, and then graphing. Students solve problems and determine the slope of the line, y-intercept and if...
Curated OER
Lines, Rays, Line Segments, and Planes
Students are introduced to lines, rays, line segments and planes. They explore the differences between lines, rays, line segments and planes. Students pracice graphing lines, rays, line segments and planes.
Curated OER
Flips, Turns, and Slides: Adventures with Transformations
Students explore transformations. In this math instructional activity, students plot points on a coordinate grid and construct shapes. Students discuss movements on the grid as flips, turns and slides.
Curated OER
Graphing Coordinates
Sixth graders practice graphing coordinates. In this geometry lesson plan, they use the x and y axis to locate points that must be connected in the right sequence to form a straight line.
Illustrative Mathematics
Two Lines
Here is a resource that helps your algebra learners understand the connection between the graph of two lines, the equations of lines, and the solutions and intersecting points of lines. It would make a great assessment question, but can...
Curated OER
Distance in Coordinate Geometry
Students analyze distance and graphing. In this geometry lesson, students work problems on a coordinate grid calculating the distance. They apply the Pythagorean Theorem to their data and answer.
Curated OER
Graphing Linear Equations
For this math worksheet, students practice graphing the linear equations on the Cartesian plane. They also create a function table for each.
Curated OER
Rational Function Graphs
Young scholars use algebraic methods to represent and solve problems. Using a graphing calculator, students solve rational and inequality problems. They visually demonstrate solutions of functions through graphing. Young scholars...
EngageNY
Finding Systems of Inequalities That Describe Triangular and Rectangular Regions
How do you build a polygon from an inequality? An engaging lesson challenges pupils to do just that. Building from the previous lesson in this series, learners write systems of inequalities to model rectangles, triangles, and even...
EngageNY
Secant and the Co-Functions
Turn your class upside down as they explore the reciprocal functions. Scholars use the unit circle to develop the definition of the secant and cosecant functions. They analyze the domain, range, and end behavior of each function.
Mathematics Assessment Project
Sorting Equations of Circles 2
How much can you tell about a circle from its equation? This detailed lesson plan focuses on connecting equations and graphs of circles. Learners use equations to identify x- and y-intercepts, centers, and radii of circles. They also...
Curated OER
Finding Domain and Range
In this domain and range worksheet, students observe a graph and identify the domain and range of given functions. Afterwards, they solve functions to identify the range. Fifteen problems are provided on this one-page worksheet.


