EngageNY
Special Triangles and the Unit Circle
Calculate exact trigonometric values using the angles of special right triangles. Beginning with a review of the unit circle and trigonometric functions, class members use their knowledge of special right triangles to find the value of...
EngageNY
Constant Rate
Two-variable equations can express a constant rate situation. The lesson presents several constant rate problems. Pupils use the stated constant rate to create a linear equation, find values in a table, and graph the points. The resource...
EngageNY
The Graph of a Linear Equation—Horizontal and Vertical Lines
Graph linear equations in standard form with one coefficient equal to zero. The lesson plan reviews graphing lines in standard form and moves to having y-coefficient zero. Pupils determine the orientation of the line and, through a...
EngageNY
The Computation of the Slope of a Non-Vertical Line
Determine the slope when the unit rate is difficult to see. The 17th part of a 33-part series presents a situation that calls for a method to calculate the slope for any two points. It provides examples when the slope is hard to...
EngageNY
The Line Joining Two Distinct Points of the Graph y=mx+b Has Slope m
Investigate the relationship between the slope-intercept form and the slope of the graph. The lesson plan leads an investigation of the slope-intercept equation of a line and its slope. Pupils realize the slope is the same as the...
EngageNY
There is Only One Line Passing Through a Given Point with a Given Slope
Prove that an equation in slope-intercept form names only one line. At the beginning, the teacher leads the class through a proof that there is only one line passing through a given point with a given slope using contradiction. The 19th...
EngageNY
The Graph of a Linear Equation in Two Variables Is a Line
Show your class that linear equations produce graphs of lines. The 20th segment in a unit of 33 provides proof that the graph of a two-variable linear equation is a line. Scholars graph linear equations using two points, either from...
EngageNY
Every Line is a Graph of a Linear Equation
Challenge the class to determine the equation of a line. The 21st part in a 33-part series begins with a proof that every line is a graph of a linear equation. Pupils use that information to find the slope-intercept form of the equation...
Virginia Department of Education
Graphing Linear Equations
Combine linear equations and a little creativity to produce a work of art. Math scholars create a design as they graph a list of linear equations. Their project results in a stained glass window pattern that they color.
EngageNY
Mid-Module Assessment Task: Grade 7 Mathematics Module 4
Assess the ability of the class to solve percent problems with an assessment that covers a variety of percent problems from basic to multi-step. Pupils make connections between percent problems and proportional thinking to complete the...
Concord Consortium
Shooting Arrows through a Hoop
The slope makes a difference. Given an equation of a circle and point, scholars determine the relationship of the slope of a line through the point and the number of intersections with the circle. After graphing the relationship, pupils...
Curated OER
Worksheet 37 - Practice Exam III - Integrals
In this integral worksheet, students use double integration to find area and volume. They identify the limits of a sequence. This one-page worksheet contains 11 problems.
Curated OER
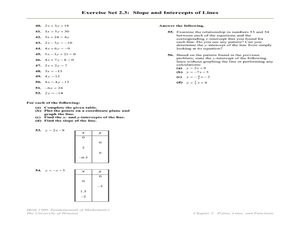
Slope, Intercepts, and Graphing a Line
In this intercepts and slope worksheet, students find the slope and/or the x and y-intercepts in fifty-three problems. Students also graph lines using the x and y-intercepts.
Curated OER
Writing Equations in Slope-Intercept Form
Use this worksheet to write equations in both point-slope form and slope-intercept form. Start by writing equations given one point and the slope and finish by writing equations given two points and a few real-world applications. The...
Curated OER
Geometry: Parallel and Perpendicular Lines
This basic handout would be good for skills practice or a review of parallel and perpendicular lines. Review the definitions, then practice writing equations of lines that pass through a specific point and are either parallel or...
Noyce Foundation
Snail Pace
Slow and steady wins the race? In the assessment task, scholars calculate the rates at which different snails travel in order to find the fastest snail. Hopefully, your class will move much more quickly in finishing the task!
Curated OER
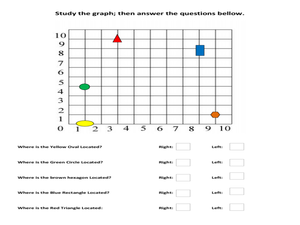
To The Right or Left?
In this right or left worksheet, students study a graph with colored shapes on it, then choose either right or left to tell where each shape is located.
Curated OER
Worksheet 4 - Math 126: Sketching Polar Equations
In this sketching polar equations worksheet, students solve 5 short answer and graphing problems. Students describe a curve given the equation of the curve in polar form. Students sketch a graph of the equation.
Curated OER
Solving Systems of Inequalities
For this algebra worksheet, students solve systems of inequality using the graphing method. There are 5 questions with lots of examples and an answer key.
Curated OER
Scrabble Problem
In this algebra instructional activity, 4th graders play a game of scrabble using equations. They use the rules for scrabble when solving the equations.
Curated OER
The Focus of an Ellipse
In this algebra worksheet, students solve for the center of an ellipse by finding the focus. They use the focus formula when solve for conics. There are 13 problems with an answer key.
Curated OER
Exponential Functions
In this algebra activity, students evaluate exponential functions using tables and graphs. There are 6 questions with an answer key.
Curated OER
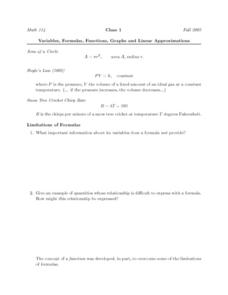
Variables, Formulas, Functions, Graphs and Linear Approximations
In this limitations of formulas worksheet, students answer four essay questions about functions. Two questions refer to the limitations of formulas. They graph one function and explain how it specifies the rule of the function.
Curated OER
Inequalities and Measures of Central Tendency
In this inequality and measures of central tendency worksheet, students solve and graph linear inequalities. They organize given data to identify the mean, mode and range. Students interpret box-and-whisker plots. This three-page...
Other popular searches
- Graphing Coordinate Planes
- Plotting Coordinate Planes
- Christmas Coordinate Planes
- Coordinate Planes Math
- Coordinate Planes Worksheets
- Coordinate Planes Blank
- Graph Coordinate Planes
- Ed Helper Coordinate Planes
- Coordinate Planes Line Graph
- Coordinate Planes Math Free


