Raytheon
Graphing: Slope
For this slope worksheet, students complete problems having to do with slope including adding integers, graphing, finding ordered pairs, and more. Students complete 55 problems.
West Contra Costa Unified School District
Solving Systems of Inequalities
Don't throw away those transparency sheets just yet! Young scholars first review inequalities on a number line, then learn about graphing inequalities in the coordinate plane. Finally, they use overhead transparencies to create systems...
Natinal Math + Science Initative
Slope Investigation
Context is the key to understanding slope. A real-world application of slope uses a weight loss scenario with a constant rate of change to introduce the concept of slope of a line, before it makes a connection to the ordered pairs and...
Curated OER
Coordinate Graphs
Students use coordinate graphs in order to identify objects and their locations. They are shown how to plot the x and y coordinates and then are given values to be plotted during guided and independent practice. Students are assessed on...
Curated OER
Graphing Inequalities in Two Variables
In this graphing inequalities worksheet, 9th graders solve and graph 6 different problems that include two variables. First, they define the given vocabulary terms found at the top of the sheet. Then, students graph each inequality...
Curated OER
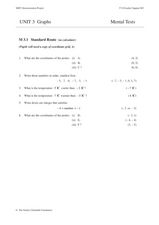
Three Sets of Mental Math Problems covering Coordinates and Integer Values
In this mental math learning exercise, students solve sixteen problems given in three sets. The problems are to be done without a calculator and they cover coordinates and integer values. The solutions are provided.
Curated OER
Generating Points and Graphing
Students create a table of values to help them plot. In this algebra lesson, students plot their points on a coordinate plane creating a graph. They observe and analyze linear functions.
Curated OER
Math Mediator Lesson 10: Slope
Students explore the concept of slope. In this Algebra I instructional activity, students investigate the definition of slope as rise over run or change in y compared to change in x. The instructional activity includes a real-world...
Curated OER
What's Your Shoe Size? Linear Regression with MS Excel
Learners collect and analyze data. In this statistics lesson, pupils create a liner model of their data and analyze it using central tendencies. They find the linear regression using a spreadsheet.
Curated OER
Slope Intercept Form
In this slope intercept form instructional activity, students solve and graph 6 different problems that include identifying the slope and intercepts in each graph. First, they determine the line that has a given x-and y-intercept. Then,...
Curated OER
Year 5 - Term 2
This incredibly thorough and challenging presentation should engage all of your young math whizzes. Each of the 94 slides has tips, problems, puzzles, and brain teasers that will test the math abilities of even your top learners. An...
Curated OER
Graphing Linear Equations Using Data Tables
Students review the Cartesian plane and the process of plotting points. In groups, students create tables, identify the slope and y-intercept, and graph the equation. Afterward, students perform the same process, only, individually. As a...
Curated OER
Slopes of Lines
In this slopes of lines instructional activity, 10th graders solve and graph 10 different problems. First, they determine the slope of each line named in the figure and any line parallel to line b and perpendicular to line d. Then,...
Curated OER
Graphs of Quadratic Equations
In this graphs of quadratic equations instructional activity, 9th graders solve and complete 9 different types of problems. First, they find the x- and y-intercept of each equation by using the quadratic formula. Then, students find the...
Curated OER
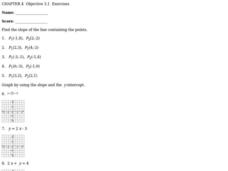
Slope of a Line
For this slope of a line worksheet, students solve ten problems determining the slope of points and an equation. First, they find the slope of the line containing the two points given in the first five problems. Then, students graph the...
Curated OER
Zoo Animal Graphing Fun
In this graphing worksheet, 2nd graders locate the zoo animals on the graph and record the correct coordinates on the line. There are 10 sets of coordinates to record.
Curated OER
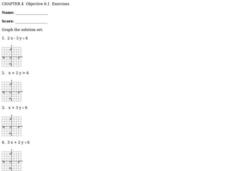
Graphing Inequalities
In this graphing inequalities worksheet, students solve and graph the solution set for eight inequalities. They first solve each inequality, either for x or for y, then they plot the coordinates found on the graph provided for each...
Curated OER
Graphs
In this graphs activity, 10th graders identify and solve 10 different problems that include reading various graphs of lines. They determine the equation for each graph whether it is dealing with tangent, cotangent, secant or cosecant.
Curated OER
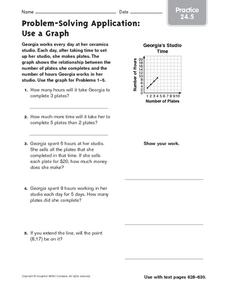
Problem-Solving Application: Use a Graph: Practice
In this graphing coordinates worksheet, learners study the graph and the coordinates. Students then answer the five questions about the graph and show their work.
Curated OER
Play Battleship with Coordinates on a Grid
In this play battleship with coordinates on a grid worksheet, students follow directions to mark their ships on their map, then guess where their opponent's ships are on the grid.
Curated OER
Equation of a Line
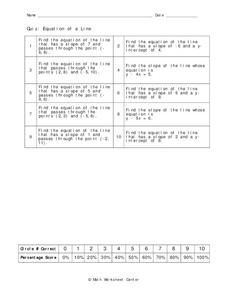
In this equation of a line worksheet, 9th graders solve 10 different problems that include the equation of a line. First, they determine the equation of a line that has a given slope and passes through a given point on a graph. Then,...
Curated OER
Graphing lines in Standard Form
For this algebra worksheet, students graph lines on a coordinate plane after rewriting the equations in the form y= mx + b. There are 12 graphing problems with an answer key.
Curated OER
Straight Line Graphs
Students discover certain equations produce straight lines. For this graphing lesson, students draw axis and problem solve to find coordinates to graph.
Curated OER
Graphing Inequalities in Two Variables
This study guide is a great resource to help you present the steps to graphing linear inequalities. Show your class two different ways to graph an inequality and work on a real-world example together. The document could also be easily...


