Curated OER
Solving Systems of Equations by Graphing
In this systems of equations worksheet, students solve each system of equations by graphing on a coordinate plane. Students identify the solution to the equations by the intersection of the two graphs. They also observe that parallel...
Curated OER
Inverse Functions
In this inverse functions worksheet, 9th graders solve and graph 10 different problems that include the inverse of various functions. First, they determine if the coordinates given is the inverse of a function given. Then, students use...
Curated OER
Equations and Inequalities
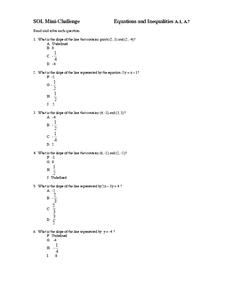
In this equations and inequalities worksheet, 9th graders solve and graph 10 different problems that include determining the slope of a line in each. First, they determine the line that contains given points on a grid. Then, students...
Curated OER
Graph Linear Inequalities
For this algebra worksheet, students solve linear inequalities and graph their results on a coordinate plane. They shade the correct side of the line. There are 8 questions with an answer key.
Curated OER
Linear Functions
In this linear function worksheet, 6th graders solve and complete 3 various types of problems. First, they write the equation of a straight line that passes through a pair of points. Then, students complete each table by filling in the...
Curated OER
Parametrics 1
In this parametric worksheet, students sketch given inequalities and use trigonometry functions to eliminate the parameters. They write equations of a line under given parameters. This four-page worksheet contains 11 multi-step problems.
Curated OER
Geometric Coordinates
In this geometric coordinates worksheet, students solve and complete 3 different types of problems. First, they use the equations provided to complete the table on the right. Then, students plot the x- and y- coordinates on the graph to...
Curated OER
Usage and Interpretation of Graphs
Learners review graphing and use processing skills to solve problems.
Curated OER
Scatterplots and Regressions
In this scatterplots and regressions instructional activity, students solve 6 different types of problems related to graphing scatterplots and interpreting regressions. First, they create a scatterplot from the given data coordinates and...
Curated OER
Slope and Intercept
In this slope and intercept worksheet, 10th graders solve 10 different problems that include the graphs of various forms of linear equations. First, they determine the slope of a line given the equation. Then, students determine if the...
Curated OER
Functions
For this functions worksheet, students solve and complete 11 different types of problems. First, they find the coordinates of all points on the graph of each equation where the tangents to the graph are horizontal. Then, students write...
Curated OER
Moving Straight Ahead
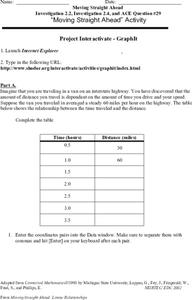
In this functions worksheet, 9th graders solve and complete 24 various types of problems. First, they complete the table with the correct distance for each hour given. Then, students enter the coordinate pairs into the function table...
Curated OER
A Real Life Example of the Distance Formula
Students answer the following question: "Using the lines of latitude and longitude, what is the distance (in degrees) if you were to travel from NASA Dryden to NASA Ames?" They use the distance formula to find the distance (measured in...
Curated OER
Walking the Plank: Student Worksheet
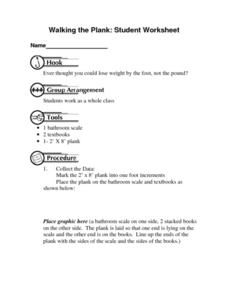
In this math worksheet, students will work in a group to experiment with the weight of objects when placed at a distance from a scale (using a plank). Students will record and graph their results.
Curated OER
Regents Exam Questions: Distance
In this distance worksheet, students solve 12 multiple choice, short answer, and graphing problems. Students use the distance formula to find the distance between two points.
Curated OER
Using Tables
In this using tables worksheet, 9th graders solve and complete 10 various types of problems that include using tables to determine information. First, they write an equation to determine the total amount. Then, students define each of...
Curated OER
Algebra 1, Unit 7, Lesson 8: Practice Finding the Equation of a Line
Students solve systems of linear equations by graphing. The introduction of the lesson asks students to work in pairs or small groups to graph a line when given two points. Students graph 14 equations on the same coordinate grid to...
Curated OER
Problem Solving: Graphing Functions
In this graphing functions learning exercise, students solve 6 word problems, finding ordered pairs, missing coordinates and numbers, slopes of lines and functions.
Curated OER
Graphs of Quadratic Functions Section 11.6
In this graphing worksheet, students graph quadratic functions. They identify the maximum and minimum value of the function, determine the line of symmetry, and locate the vertex. Coordinate planes are provided for each function. There...
Curated OER
Graphing Linear Equations with Calculator
Students graph lines using the calculator. In this algebra lesson, students graph lines of equations in the form y=mx+b. They input equations into the TI Calculator and graph using the slope and intercept. They analyze the graph for...
Curated OER
Parabolas
In this parabolas worksheet, 11th graders solve and complete 12 different problems. First, they use the graph to write the equation of each parabola. Then, students name the vertex for each and write their responses on the line provided.
Curated OER
Comparison of Two Different Gender Sports Teams - Part 3 of 3 Scatter Plots and Lines of Best Fit
Students create a scatter plot for bivariate data and find the trend line to describe the correlation for the sports teams. In this scatter plot lesson, students analyze data, make predictions,and use observations about sports data...
Curated OER
Line, Ray, Segment
Students define vocabulary words. In this geometry lesson, students identify the graph as a line, ray or segments. They understand the properties of each and calculate the distance on a number line.
Curated OER
What's Up With My Class
Students collect data about their class and they use Excel spreadsheet to display their tables and graphs about the class. They answer survey questions and collect their data. Students create a graph of their choice to display the...


