Geophysical Institute
Latitude and Longitude with Google Earth
Travel the world from the comfort of your classroom with a lesson that features Google Earth. High schoolers follow a series of steps to locate places all over the earth with sets of coordinates. Additionally, they measure the distance...
Kenan Fellows
Math Made Simple as 1-2-3: Simplified Educational Approach to Algebra
Writing an equation of a line is as easy as m and b. A lesson presentation gives individuals different strategies for writing equations of lines. Some items provide a slope and a point while others provide two points. Whatever the given,...
Curated OER
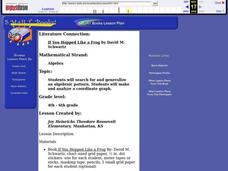
"If You Hopped Like a Frog" by David M. Schwartz
Young scholars search for and generalize an algebraic pattern. They make and analyze a coordinate graph.
Curated OER
Writing Linear Equations in Different Forms
Can your class write linear equations three different ways? Here is a study guide that includes slope-intercept, standard, and point-slope forms. Learners are given the slope and a point on the line, or two points and are asked to write...
Curated OER
Writing Linear Equations in Slope-Intercept Form
In this math worksheet, students are given three lines graphed on a coordinate grid. Students identify the slope, intercepts, and write an equation for each. Students find the intercepts of a linear equation, and graph them. They write...
Curated OER
Reflections
Students investigate image and pre-image. In this geometry lesson plan, students identify the reflection and rotation of different shape on a coordinate plane. They identify similarities and differences of image and pre-image of a...
Curated OER
Building a Rover
Middle schoolers investigate properties of lines and points by making a rover. In this algebra lesson, students plot points correctly on a coordinate plane. They identify coordinate pairs given the plots and lines.
Curated OER
Unit 5: Worksheet 4 - Proportions
In this proportion worksheet, students use proportions to find the missing side of similar triangles, they identify the percent of a number, and graph points on a coordinate plane. Students solve real life story problems dealing with...
Bytes Arithmetic
Geometry Pad+
Graphing paper, pencil, ruler, protractor, and compass, all get replaced or supplemented with this dynamic geometry application. Here, you can create, move, and scale many different shapes, as well as, explore and change their properties...
Curated OER
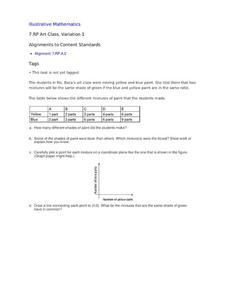
Art Class, Variation 1
Student statisticians calculate ratios to determine how many shades of green were mixed by Ms. Baca's art class. They graph the number of blue parts against the number of yellow parts for each combination and discover that some produce...
EngageNY
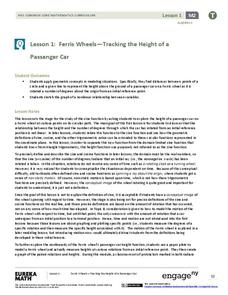
Ferris Wheels—Tracking the Height of a Passenger Car
Watch your pupils go round and round as they explore periodic behavior. Learners graph the height of a Ferris wheel over time. They repeat the process with Ferris wheels of different diameters.
Teach Engineering
Can You Resist This?
Some things are hard to resist. Small collaborative groups build circuits and calculate the voltage using Ohm's Law. Budding engineers explore the connection between the voltage across different resistors and linear functions with...
Curated OER
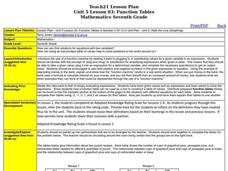
Function Tables
Students identify function using tables of data. In this algebra instructional activity, students create a tale of point and plot on a coordinate plane. They analyze the graph as being a function or not.
Curated OER
Solutions, Solutions, Could it Be?
Pupils graph and solve linear system of equations. In this algebra lesson, students use algebraic and graphing methods to solve their systems. They find the point of intersection for their solution and draw inference from their data.
Curated OER
Properties of Curves
In this Calculus activity, students use a graphing calculator to boost their understanding of functions and their graphs as they examine the properties of curves. The forty-two page activity contains one hundred problems. Answers are...
Curated OER
Finding the Area of a Parallelogram with Translations
Learners calculate the area of a parallelogram. In this geometry lesson, students perform translation using a coordinate plane and coordinate pairs. They perform translation on other polygons.
Curated OER
Using a Multi- Sensory Approach
Students identify the slope of a line given two points on the line. In this algebra lesson plan, students solve linear equations by finding and comparing slopes of lines. They differentiate between the steepness of the slope and the line.
Curated OER
How Much Will I Spend On Gas?
Students construct a linear graph. For this graphing lesson, students determine a monthly budget for gasoline. Students construct a t-chart and coordinate graph to display data. Resources are provided.
Curated OER
Linear Functions, Restricted Domains, Infinite Geometric Series, Interconnections
In this math worksheet, students graph the linear functions in comparison to the inequalities. Then they compare the line segments on the coordinate plane.
Curated OER
Symmetry in Kaleidoscope Designs
Students define reflection, rotation and symmetry. In this symmetry lesson, students move the graph around the coordinate plane and identify the line of symmetry. They identify the different designs of a kaleidoscope.
Curated OER
Bungee M&M's
Eighth graders experiment with M&M's and a cup attached to a spring to to simulate a bungee jump. They graph the results of the experiment and make predictions for continuing the experiment. They determine the "line of best fit."
Curated OER
Reflection
Eighth graders use a stencil to make a figure with which they discover the horizontal line of reflection, the vertical line of reflection, and the diagaonal line of reflection using coordinates.
Curated OER
Math 53 - Review for Midterm 1
In this review for midterm, students use parametric equations to find points on a curve, explore conic sections, write vector functions, and sketch cylindrical coordinates. This two-page review contains 10 multi-step problems.
Curated OER
Investigation - Looking For Triangles
Seventh graders investigate a series of triangles, looking for patterns and generalizing what they have found. They analyze the pattern data and organize it into a table and graph. Students identify the relationship and discover the rule...


