Curated OER
Where is ? ? ? ?
Students explain and explain the concept of a grid system. They define absolute and relative location and develop an imaginary city on graph paper using a grid system.
Curated OER
Parabolas
Students find equations of parabolas in real world scenarios. In this finding equations of parabolas in real world scenarios lesson, students find the equations of parabolas of US landmarks. Students put a grid on landmarks such as the...
Alabama Learning Exchange
Scaling Down the Solar System
Learners work collaboratively to gain a better understanding of the vastness of space by scaling down the solar system. They measure by inches, gain an understanding of space, and model the distances of the planets from the sun.
Curated OER
Solving Systems of Inequalities
For this algebra worksheet, students solve systems of inequality using the graphing method. There are 5 questions with lots of examples and an answer key.
Curated OER
Science: Hurricanes As Heat Engines
Young scholars conduct Internet research to track the path of Hurricane Rita. They record the sea surface temperature of the Gulf of Mexico during and after the hurricane and draw conclusions about how hurricanes extract heat energy...
West Contra Costa Unified School District
Sneaking Up on Slope
Pupils determine the pattern in collinear points in order to determine the next point in a sequence. Using the definition of slope, they practice using the slope formula, and finish the activity with three different ways to determine the...
Inside Mathematics
Functions
A function is like a machine that has an input and an output. Challenge scholars to look at the eight given points and determine the two functions that would fit four of the points each — one is linear and the other non-linear. The...
Curated OER
Inquiry Unit: Modeling Maximums and Minimums
Young mathematicians explore the maximun area for patio with the added complexity of finding the mimimum cost for construction. First, they maximize the area of a yard given a limited amount of fence and plot width v. area on a scatter...
Curriculum Corner
8th Grade Math Common Core Checklist
Ensure your eighth graders get the most out of their math education with this series of Common Core checklists. Rewriting each standard as an "I can" statement, this resource helps teachers keep a record of when each standard was taught,...
EngageNY
Secant and the Co-Functions
Turn your class upside down as they explore the reciprocal functions. Scholars use the unit circle to develop the definition of the secant and cosecant functions. They analyze the domain, range, and end behavior of each function.
Curated OER
Hyperbolas
Students engage in a lesson that covers the concepts related to the graphing of hyperbolas looking at topics like foci, center, vertices, and asymptotes. They find multiple different points in the coordinate plain and then plot the graph.
Curated OER
Solve a System of Inequalities
In this system of linear inequalities activity, students solve 5 problems with the graphing method and are given 2 examples with multiple steps to follow.
Curated OER
Slopes and Linear Equations
Students find the slopes of linear functions. For this graphing lesson, students analyze linear equations and calculate the slope of the line. They graph a line given the slope and y-intercept.
Curated OER
How Many Solutions 2
Students solve systems of equations. In this algebra lesson, students graph lines and identify the point of intersection. They identify the function to see if it is a function.
Curated OER
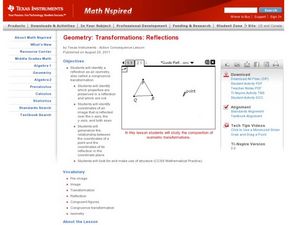
Transformations: Reflections
Students perform transformations on their graphs. In this algebra lesson, students identify the pre-image and image. They find and identify congruent shapes and isometry.
Curated OER
Exploring Transformations: Translations and Reflections
Learners perform translation and reflection. They identify the coordinate points of the new graph and create a formula for the movement. They identify the pre-image the and after image.
Curated OER
Slopes and Slope Intercepts
Young scholars identify the slope of an equation using various methods. In this algebra instructional activity, students graph linear equations and calculate the slopes using the x and y intercept to solve the equations and graph the...
Curated OER
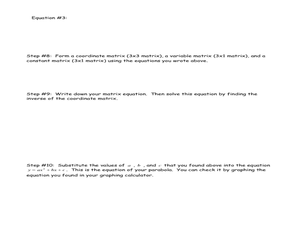
Quadratic Equations and Parabolas
Students graph and solve quadratic equations. In this functions lesson, students analyze a quadratic equation using three points on a curve to define the graph of a quadratic function. They find the vertex and intercepts of the graph.
Curated OER
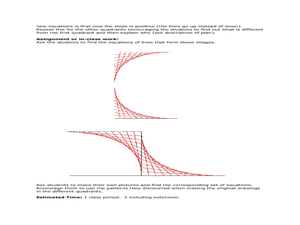
Mathematics of Doodles
Students use the slope and y-intercept to graph lines. In this algebra instructional activity, students graph linear equations and apply it to solving real life problems.
Curated OER
Slope Exploration
In this slope exploration activity, 9th graders solve and complete 18 different problems that include graphing and investigating the slope of various equations. First, they graph each pair of points and draw a line that contains both...
Curated OER
Walking Home II
Students explore the relationship between distance and time. They analyze a situation involving distance traveled in a given period of time, represent the situation graphically and algebraically, and discuss the concept of slope as a...
Curated OER
How Many Solutions to the System?
Solve systems of equation using graphing! In this algebra lesson, young scholars use the TI to graph two lines and identify the number of solutions. They perform interactive graphing on the navigator.
Curated OER
Solving Inequalities
In this inequalities worksheet, students solve and graph inequalities. They shade the answer region. Explanations and examples are provided at the beginning of the document. Answers are at the end of the worksheet. This four-page...
Curated OER
Approximation of Pi
Learners explore the concept of Pi. In this Pi lesson, students measure the circumference and diameter of a circle. Learners record the diameter and circumference measurements from their classmates. Students enter the data into lists...


