Education Development Center
Points, Slopes, and Lines
Before graphing and finding distances, learners investigate the coordinate plane and look at patterns related to plotted points. Points are plotted and the goal is to look at the horizontal and vertical distances between coordinates and...
Curated OER
Treasure Hunt: Coordinate Graphing
Two of the best words any one can hear– treasure hunt! Your class will be excited to practice graphing on a coordinate grraph as they identify and write coordinates for landmarks they see on a treasure map. They trace their route to the...
Curated OER
Challenge: Graphing Functions
Here is a functions worksheet in which learners solve functions containing variables, graph the coordinates, and answer two questions about it. They complete 14 functions.
Curated OER
Locating Points Using Cartesian Coordinates
Students discover coordinates as they explore Chicago. In this math lesson plan, students give the coordinates of a point, plot a point, and use the coordinate system in locating places on a map.
Curated OER
Graphing Functions
In this graphing functions worksheet, 10th graders solve 10 different problems that illustrate various graphs of functions. They determine the type of function that each graph shows. Then, students write the equation for the line graphed...
Curated OER
Graphing Functions
In this graphing functions worksheet, students solve and complete 13 different problems that include identifying and graphing various functions. First, they graph each of the functions shown on the graphs provided. Then, students solve...
Curated OER
Graphing
In this graphing worksheet, students solve and graph 10 different problems that include determining various coordinates and the slope. First, they use the table to write the x and y coordinates for each point on the graphs. Then,...
Curated OER
Graphing Greenery
Students gather leaves and trace them on graph paper. They plot coordinates that approximate the shape of the leaves and share those coordinates as "worksheets" for other students to complete.
Curated OER
Slope, Vectors, and Wind Pressure
A hands-on lesson using the TI-CBR Motion Detector to provide information to graph and analyze. The class uses this information to calculate the slope of motion graphs and differentiate scalar and vector quantities. There is a real-world...
Curated OER
Graphing Quadratic Functions
In this graphing quadratic functions instructional activity, students create a function table and graph quadratic functions. This four-page instructional activity contains 33 problems. A graph is supplied with each function. One example...
EngageNY
The Graph of a Linear Equation in Two Variables Is a Line
Show your class that linear equations produce graphs of lines. The 20th segment in a unit of 33 provides proof that the graph of a two-variable linear equation is a line. Scholars graph linear equations using two points, either from...
EngageNY
The Line Joining Two Distinct Points of the Graph y=mx+b Has Slope m
Investigate the relationship between the slope-intercept form and the slope of the graph. The lesson plan leads an investigation of the slope-intercept equation of a line and its slope. Pupils realize the slope is the same as the...
EngageNY
There is Only One Line Passing Through a Given Point with a Given Slope
Prove that an equation in slope-intercept form names only one line. At the beginning, the teacher leads the class through a proof that there is only one line passing through a given point with a given slope using contradiction. The 19th...
Virginia Department of Education
Graphing Linear Equations
Combine linear equations and a little creativity to produce a work of art. Math scholars create a design as they graph a list of linear equations. Their project results in a stained glass window pattern that they color.
CK-12 Foundation
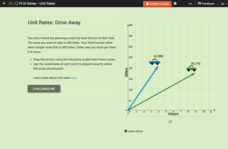
Comparison of Unit Rates: Drive Away
Five questions make up an interactive that challenges mathematicians to compare unit rates. Word problems question scholars about two friends going on a road trip. Scholars manipulate two cars on a coordinate plane to help solve word...
Curated OER
Walking the Plank
This is a cool math activity. Kids collect and interpret data based on a physical act. A board is balanced between a scale and a step, learners record a peer's weight as it decreases while s/he walks further away from the scale. They...
Mt. San Antonio Collage
Quadratic Functions and Their Graphs
Starting with the basics, learners discover the features of a parabola and the ways to accurately graph it. After pupils practice with graphing, the end of the worksheet focuses on application type problems.
Curated OER
Understanding Latitude and Longitude
Teaching learners about latitude and longitude can get a little complicated. Present the concept by first representing it as a graph. Just like finding a location on a graph using the x and y-axis, learners will be able to locate items...
Curated OER
Reading Graphs
Students plot functions on the Cartesian coordinate plane. They explore lines and parabolas. Students analyze graphs and answer questions about the information presented on the graph using an online program.
Curated OER
Graphing Game
Students explore the concept of graphing ordered pairs. In this graphing ordered pairs lesson, students work in teams to play a version of Connect 4. Students use a Cartesian grid with values -4 to 4 as their Connect 4 board. Students...
Curated OER
Plot the x-y Coordinates on the Grids Below
In this coordinate grid graphing worksheet, students plot the given points onto each of 6 coordinate grids. All points are located in quadrant 1. One point is plotted on each grid. Answers are given by clicking the appropriate place on...
Curated OER
Transforming Triangles
Sixth graders graph translations (slides) and reflections (flips) on a coordinate plane. They visualize and identify geometric shapes after applying transformations on a coordinate plane. Finally, 6th graders write a paragraph telling...
Curated OER
Stars and Slopes
More of a math lesson than physics or space science, high schoolers take a set of data and plot it on a log-log coordinate system. The write-up for day two was never completed, but day one, "Stars and Slopes," is complex and cohesive....


