Curated OER
Coordinate Graphs, Translations and Reflections
Students perform translations and reflections. For this algebra lesson, students use the TI calculator to graph functions. They move the functions around on the coordinate plane using translation and reflection.
Curated OER
Measuring Segments
In this measuring segments learning exercise, 10th graders solve 12 different problems related to determining the measurements of various segments. First, they determine each missing measure given the information. Then, students find the...
Curated OER
Graphs & Equations of Lines
In this graphs and equations of lines worksheet, 10th graders solve 12 different problems that include graphs and various equations of lines. First, they determine the slope of a line that passes through two sets of points. Then,...
Curated OER
Math Journal: Functions and Coordinate Geometry
Fifth graders examine the many uses of coordinate grids. In this graphing lesson, 5th graders write data driven equations, discuss the x and y-axis, and determine if using 2 or 3 ordered pairs is better. Students complete several...
Curated OER
Finding Equations From Graphs
In this equations from graphs worksheet, 9th graders solve and graph 10 different problems that include determining the actual equation for each. First, they determine the slope and y-intercept for each graph shown on the right. Then,...
Curated OER
Math A Regents Questions: Points on a Line
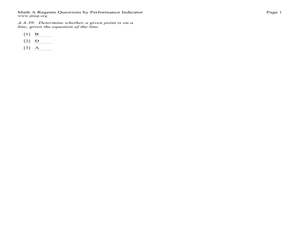
In this linear equations worksheet, students solve 3 multiple choice problems. Students determine if a given point lies on a line given an equation of that line.
EngageNY
Some Facts About Graphs of Linear Equations in Two Variables
Develop another way to find the equation of a line. The instructional activity introduces the procedure to find the equation of a line given two points on the line. Pupils determine the two points from the graph of the line.
EngageNY
Lines That Pass Through Regions
Good things happen when algebra and geometry get together! Continue the exploration of coordinate geometry in the third lesson in the series. Pupils explore linear equations and describe the points of intersection with a given polygon as...
Concord Consortium
Rational and Not So Rational Functions
Do not cross the line while graphing. Provided with several coordinate axes along with asymptotes, pupils determine two functions that will fit the given restrictions. Scholars then determine other geometrical relationships of asymptotes...
Curated OER
Straight Graph Lines: Coordinates
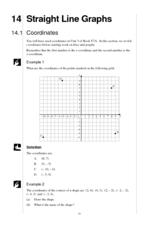
Learners access prior knowledge of coordinates. In this coordinates lesson, students graph coordinate points to create a symmetrical figure and of a straight line. Learners complete several practice examples.
Curated OER
Graphing Inequalities
In this graphing inequalities worksheet, students complete 8 inequality tables. Students then graph and shade the 8 inequalities on a coordinate plane.
Curated OER
Profitable Soda Stand
Am I making any money? Help learners determine if their fictitious soda stand is turning a profit. They graph linear equations using the slope and y-intercept and identify the best price to use to sell soda. They identify the domain and...
EngageNY
The Computation of the Slope of a Non-Vertical Line
Determine the slope when the unit rate is difficult to see. The 17th part of a 33-part series presents a situation that calls for a method to calculate the slope for any two points. It provides examples when the slope is hard to...
Ohio Literacy Resource Center
Solving Systems of Linear Equations Graphing
Do you need to graph lines to see the point? A thorough lesson plan provides comprehensive instruction focused on solving systems of equations by graphing. Resources include guided practice worksheet, skill practice worksheet, and an...
CK-12 Foundation
Graphs of Linear Functions: Line Designs
Designs from lines are sublime. Scholars create colorful designs by connecting points on an interactive coordinate plane. They answer questions about slope and quadrants based on their designs.
Curated OER
Cartesian Coordinates
Students investigate rational numbers through data analysis and statistics. For this algebra lesson, students represent, rename, compare and order rational numbers. They collect and represent data correctly on a graph.
Raytheon
Equations and Graphing Review
In this equations and graphing review instructional activity, learners write, graph and solve equations for 62 problems, including a mid-unit review, with answers included.
Curated OER
Lines, Rays, Line Segments, and Planes
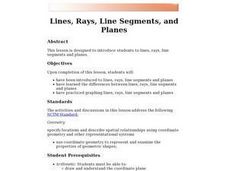
Students are introduced to lines, rays, line segments and planes. They explore the differences between lines, rays, line segments and planes. Students pracice graphing lines, rays, line segments and planes.
Alabama Learning Exchange
We Love to Graph!
Young scholars experience graphing points. In this graphing points instructional activity, students play an on-line game where they must name 10 coordinate pairs correctly. Young scholars play a maze game where they maneuver a robot...
Curated OER
Interpreting Graphs
Students investigate graphs. In this graphing lesson, students create a graph regarding the population of California. Students extrapolate answers concerning the data set.
Curated OER
Plugging Into The Best Price
Examine data and graph solutions on a coordinate plane with this algebra lesson. Young problem-solvers identify the effect of the slope on the steepness of the line. They use the TI to graph and analyze linear equations.
California Education Partners
Science Fair Project
Plant the data firmly on the graph. Given information about the growth rate of plants, pupils determine the heights at specific times and graph the data. Using the information, scholars determine whether a statement is true and support...
Baylor College
Global Atmospheric Change: The Math Link
Change up the classroom atmosphere with this interdisciplinary resource. Following along with the children's book Mr. Slaptail's Curious Contraption, these math worksheets provide practice with a wide range of topics including simple...
Radford University
How to Calculate and Analyze the Equation for a Parabolic Path
Working in groups, pupils plot three points on the coordinate plane representing three different parabolic paths. Using a calculator, they determine the quadratic regression equation for their models. Each team then figures out the...


