Shodor Education Foundation
Transmographer
Introducing ... the Transmographer. Young mathematicians investigate translations, reflections, and rotations. The applet lets users perform transformations on triangles, squares, and parallelograms.
Shodor Education Foundation
Data Flyer
Fit functions to data by using an interactive app. Individuals plot a scatter plot and then fit lines of best fit and regression curves to the data. The use of an app gives learners the opportunity to try out different functions to see...
Shodor Education Foundation
Graphit
No graphing calculator? No worries, there's an app for that! Young mathematicians use an app to graph functions. In addition, they can also plot data points.
Shodor Education Foundation
Conic Flyer
Graphing conics made easy. Individuals use an interactive to graph conic sections. The app can handle circles, vertical and horizontal parabolas, ellipses, and vertical and horizontal hyperbolas.
Shodor Education Foundation
Linear Inequalities
An interactive lesson helps individuals learn to graph inequalities in two variables. Scholars can adjust the interactive to present the inequalities in standard or slope-intercept form.
Shodor Education Foundation
Multi-Function Data Flyer
Explore different types of functions using an interactive lesson. Learners enter functions and view the accompanying graphs. They can choose to show key features or adjust the scale of the graph.
5280 Math
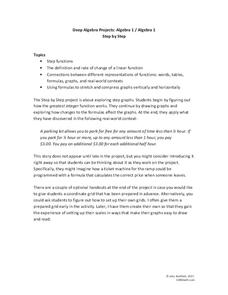
Step by Step
One step at a time! A seemingly linear relationship becomes an entirely new type of function. Young scholars build their understanding of step functions by completing a three-stage activity that incorporates multiple representations of...
Curated OER
Collecting And Fitting Quadratic Data
Students investigate the concept of using quadratic data to plot coordinates on a plane. They also apply the quadratic formula for a variety of problems with the help of a graphing calculator to draw the parabola for given coordinates.
Curated OER
Convolution Method
In this convolution method activity, students solve 4 different equations related to convolution methods. First, they create a combined plot of the three different solutions and the forcing function. Then, students use any method...
Curated OER
System of Axes
In this system of axes instructional activity, 10th graders solve and complete 1 word problem. First, they determine the figure shown in the illustration and set-up an expression. Then, students solve to find the shaded region of the...
Curated OER
Solving Systems of Inequalities
In this algebra worksheet, students solve systems of inequality using the graphing method. There are 5 questions with lots of examples and an answer key.
Curated OER
Comparing Data on Graph A and Graph B
Second graders gather and graph data. In this graphing instructional activity, 2nd graders collect data and graph this information using tally charts, bar graphs, pictographs, or tables. They make predictions about the outcomes.
Curated OER
Calculating Total From Percents
Using this short review of finding a percentage of a number, learners can practice important skills. There are twelve questions on this worksheet.
Curated OER
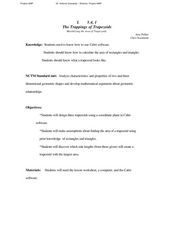
The Trappings of Trapezoids
Students define trapezoids and their shapes. In this geometry lesson plan, students calculate the area of a trapezoid and a parallelogram. They use Cabri software to make investigations.
Curated OER
Solve a System of Inequalities
In this system of linear inequalities worksheet, students solve 5 problems with the graphing method and are given 2 examples with multiple steps to follow.
Curated OER
Percentages: Calculating Percent-1
In this percentages instructional activity, students calculate percentages in eighteen problem solving percentage equations. Students show each step of their work.
Curated OER
Transfromations
In this geometry activity, 10th graders solve questions that involve rotations, reflections, and dilations. The one page activity contains ten multiple choice questions. Answers are not provided.
Curated OER
Percentages: Decimals To Percent
In this percentages learning exercise, students write twelve decimals as percentages and twelve percentages as decimals. Students check their answers with the key when they are finished.
Curated OER
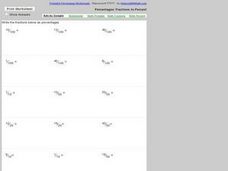
Percentages: Fractions To Percent
In this percentages worksheet, students write eighteen fractions as percentages. Students problem solve each fraction as a percentage.
CK-12 Foundation
Ck 12: Geometry: Polygon Classification in the Coordinate Plane
[Free Registration/Login may be required to access all resource tools.] Graph geometric figures given the ordered pairs of vertices.
CK-12 Foundation
Ck 12: Geometry: Dilation in the Coordinate Plane
[Free Registration/Login may be required to access all resource tools.] This concept explores graphing a dilation given a description of the dilation. Students examine guided notes, review guided practice, watch instructional videos and...
ClassFlow
Class Flow: Coordinate Plane
[Free Registration/Login Required] This is an introduction lesson to the coordinate plane and ordered pairs for 7th grade math.
CK-12 Foundation
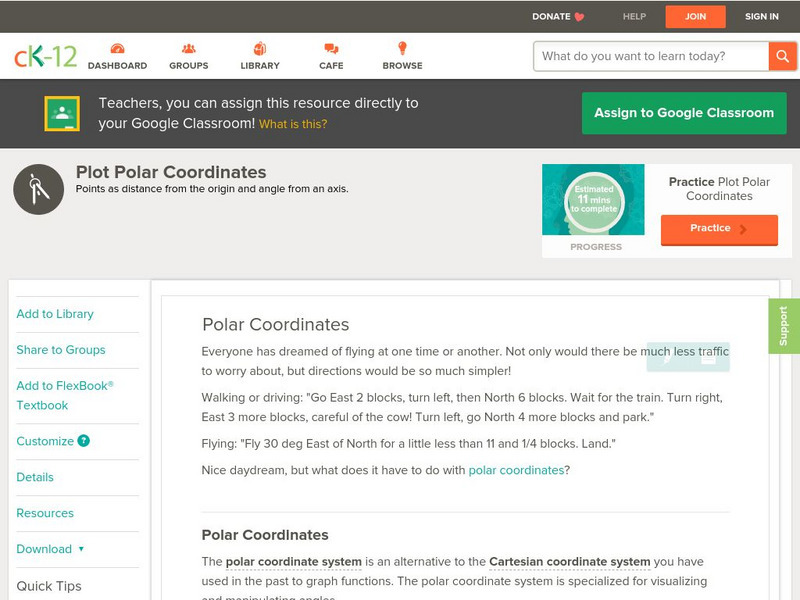
Ck 12: Plot Polar Coordinates
[Free Registration/Login may be required to access all resource tools.] Here you will learn how to convert and graph complex numbers in trigonometric or polar form using the polar coordinate system, which is similar in some ways to (x,...
CK-12 Foundation
Ck 12: Defining Rotations
[Free Registration/Login may be required to access all resource tools.] In this tutorial, students learn about the rules that operate in the rotation of 2-D figures on a coordinate grid. Includes video, lots of examples, review...


