Noyce Foundation
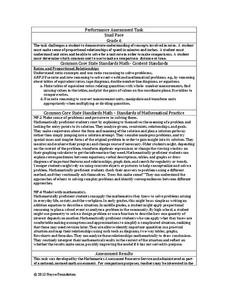
Snail Pace
Slow and steady wins the race? In the assessment task, scholars calculate the rates at which different snails travel in order to find the fastest snail. Hopefully, your class will move much more quickly in finishing the task!
Curated OER
Student Exploration: Summer and Winter
In this recognizing the seasons online/interactive worksheet, learners explore the Earth's positions and determine the summer and winter season. Students answer 21 short answer questions
Curated OER
Hide and Seek with Geocaching
Learners locate objects using a Global Positioning System. In this global geography lesson, students explore latitude and longitude using a GPS in order to locate objects.
Curated OER
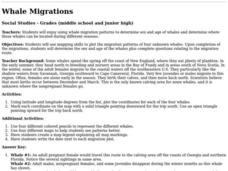
Whale Migrations
Students use whale migration patterns to determine sex and age of whales and determine where these whales can be located during different seasons. They use mapping skills to plot the migration patterns of four unknown whales.
Curated OER
Earthquake Analysis
Students analyze and plot the coordinates for several recent earthquakes on a world map. They learn not only about research and geology, but about map-making and data analysis. They think of other ways to analyze the data given.
Curated OER
Gridding An Archaeological Site
Students investigate using some of the basic skills of an archaeologist while using a Cartesian coordinate system. They establish a grid system for a dig site and determine the locations for different artifacts. Students use the...
Curated OER
Ecosystems Online
Students work together to gather information on ecosystems from websites. They identify plants and animals and create their own website. They are graded on their willingness to work together and the content on the website.
Curated OER
Complex Analysis: Transformations
For this transformation worksheet, students find the linear transformation of equations and use the Mobius transformation to identify image boundaries. Students describe the images in each quadrant. This two page worksheet contains six...
Curated OER
Earth Viewer
Students explore the Earth. In this space lesson plan, students view the " Earth and Moon Viewer" web site and complete a related worksheet.
Curated OER
2 x 2
Middle schoolers work together to grid a 2 x 2 meter unit using the formula for the Pythagorean Theorem. After creating the grid, they identify the location of artifacts and create a map of their location. They develop a graph and table...
Curated OER
Our State Road Trip
Students take a virtual tour of the country of China instead of a state. Using the Internet, they examine the differences between a political and physical map and use latitude and longitude to locate specific places. They also research...
Curated OER
Corps of Discovery
Students assess their knowledge of the Corps of Discovery through a written pretest, follow the journey of Lewis and Clark on the internet, record data on events, dates, places, people, animals, distance traveled, and geographic...
Curated OER
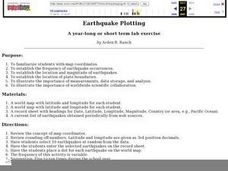
Earthquake Plotting
Students become familiar with map coordinates. They establish the frequency of earthquake occurrences and study the location and magnitude of earthquakes. To establish the location of plate boundaries.
Curated OER
Graphing Ordered Pairs
In this math worksheet, students learn to graph ordered pairs. Students examine a graph with 3 labeled points and tell the ordered pairs for each. Students also plot 8 ordered pairs on a graph they draw themselves.
Curated OER
Subsidence/ Erosion
Students utilize prior knowledge about the Pontchartrain Basin. In this subsidence/erosion lesson, students study the chart on land subsidence and must them identify and find solution for problems caused by erosion.
Curated OER
Attu: North American Battleground of World War II
Students examine military maps and photos to better explain why an isolated battle on a remote island in Alaska alarmed the nation. They explain how the Japanese occupation and American recapture of Attu were significant in the history...
Curated OER
A Biome to Call Home
Young scholars research, present, and compare information about the features of seven biomes that exist in the U.S. They view and discuss the images on the Arkansas state quarter, conduct research on the biomes, and create a poster of...
Curated OER
Rivers Bridge State Historic Site
Students use maps, readings, illustrations and photos to analyze the Civil War Rivers Bridge battlefield and describe how geography affected the outcome of the battle. They explore and explain the causes for the battle's heavy human...
Curated OER
Introducing the Bartered Bride
Students discuss the character, plot, and setting for Smetana's opera The Bartered Bride. The teacher begins with a "KWL" strategy map on "opera." In this "KWL, the teacher asses what students have already experienced about the opera and...
Curated OER
Measurement and the Illampi Mound Colony
Students comprehend the basic units of measurement, scale, plotting, and basic grids. Students practice their estimation
and measuring skills and will demonstrate their ability to work well in groups.
Curated OER
The Tale of Scale
Eighth graders, using a range of data, produce three bar graphs for various scales along the y-axis.
Curated OER
Measurement and Data Collecting using Image Processing
Students trace the route of the historical event and measure the distance over which the people involved journeyed. A data sheet be constructed outlining the location of events, and the speed with which the journey occurred.
Alabama Learning Exchange
The Sun and the Earth
Third graders study and diagram the positions of the Earth and sun during the four seasons. They predict weather for cities in the northern and southern hemispheres.


