Curated OER
Barbie Bungee
Middle and high schoolers collect and analyze their data. In this statistics activity, pupils analyze graphs for linear regression as they discuss the relationship of the function to the number of rubber bands and the distance of the...
Missouri Department of Elementary
Positive Self Talk
Mirror, mirror. Hook sophomores into the benefits of positive self-talk with a lesson that asks them to reflect on the roles they play at home, at school, and in their communities. Class members fill out a “Looking At Me In My...
Curated OER
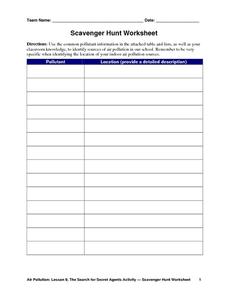
Scavenger Hunt Worksheet
Exactly how environmentally friendly is your school? From the air fresheners in the bathrooms to the cleaning solvents used in the classrooms, young conservationists search the school grounds for sources of air pollution in...
Shodor Education Foundation
Conic Flyer
Graphing conics made easy. Individuals use an interactive to graph conic sections. The app can handle circles, vertical and horizontal parabolas, ellipses, and vertical and horizontal hyperbolas.
Shodor Education Foundation
Linear Inequalities
An interactive lesson helps individuals learn to graph inequalities in two variables. Scholars can adjust the interactive to present the inequalities in standard or slope-intercept form.
Shodor Education Foundation
Multi-Function Data Flyer
Explore different types of functions using an interactive lesson. Learners enter functions and view the accompanying graphs. They can choose to show key features or adjust the scale of the graph.
Shodor Education Foundation
Pythagorean Theorem
Most adults remember learning about the Pythagorean theorem, but they don't all remember how to use it. The emphasis here is on developing an intuitive understanding of how and when to use the theorem. Young mathematicians explore...
Missouri Department of Elementary
My Conflict Shield
As an exercise in self-awareness and improvement, class members create a Conflict Shield listing 12 skills they believe are the most useful in conflict resolution. They then color the ones they have mastered while leaving uncolored those...
Curated OER
Storm Clouds-- Fly over a Late Winter Storm onboard a NASA Earth Observing Satellite
Students study cloud data and weather maps to explore cloud activity. In this cloud data instructional activity students locate latitude and longitude coordinates and determine cloud cover percentages.
Curated OER
When Will We Ever Use This? Predicting Using Graphs
Here are a set of graphing lessons that have a real-world business focus. Math skills include creating a scatter plot or line graph, fitting a line to a scatter plot, and making predictions. These lessons are aimed at an algebra 1...
University of Wisconsin
Rain Garden Species Selection
The activity really comes to life within its intended unit on starting a rain garden. Working in groups, participants research native plants and coordinate them with the conditions in the designated garden area. Give the class access to...
Curated OER
Models of Chemical Families
A simple activity for introductory chemistry classes is thoroughly explained in this lesson plan. Each individual receives a sealed box containing an unknown object. Inquisitors use indirect evidence to draw conclusions. This activity is...
Curated OER
Impossible Graphs
Students practice plotting functions on the Cartesian coordinate plane while participating in a discussion about the Possible Or Not worksheet/activity. Students also use the Impossible Graphs worksheet to practice reading a graph,...
Curated OER
Organizing Principles of Plants and Animals
Three lessons and five assessments are contained in this material. Various paper shapes are sorted as a simulation of biological classification. Learners gather a list of living things that they are familiar with and design a...
Curated OER
Genetic Variability
Using black and white construction paper, evolutionary biologists simulate the classic peppered moth study. They use beans in a frequency and natural selection exercise. Finally, they analyze germinated seeds for variations. All three...
Curated OER
Example of Convection
Compare the density of different salt solutions and then observe currents that are caused by the difference. Set up a demonstration of dynamic equilibrium. The intent with these activities is to begin building understanding of density...
Curated OER
Construction of Food Chains and Tracing Energy Changes
If you need a few basic activities for teaching food chains to your emerging ecologists, here they are. Three sheets of organism cards are included for learners to cut out and arrange according to trophic relationships. To make the most...
Curated OER
Trophic Pyramids and Levels
The bulk of this lesson involves the construction of both an aquatic and a terrestrial ecosystem in which to observe trophic relationships. Detailed directions are provided, as well as discussion questions, and assessment activities....
Curated OER
Investigation-Looking at Polygons
Eighth graders plot points and investigate polygons. They locate a point, using ordered pairs of integers on the coordinate plane. Students compare geometric measurements and computations on coordinate axes as they are applied to...
Curated OER
Graphs and Functions
Use this series of activities to introduce learners to graphing functions. They graph both linear and quadratic equations by hand and with a Graph Sketcher Tool. Several imbedded links and handouts are included in the lesson.
Curated OER
Combining Sentences: Correct Punctuation of Phrases and Clauses
Break down the particularities of sentence combining with this explanatory handout. Using three example sentences, the handout demonstrates a variety of ways to combine sentences. This resource could act as a reference sheet for your...
Curated OER
Graphing X, Y, Z
Seventh graders explore how proportion controls the image of a drawing. They examine a coordinate plane and discuss plotting. Student experiment drawing an object one size, and then drawing an identical object on a different scale.
Curated OER
Great Lakes Snow Analysis Collaborative Network
Middle schoolers interpret data on snow cover and analyze trend patterns. In this snow lesson students compare data and locate their school's GPS coordinates.
Curated OER
The Trapping of Trapezoids
This is a nice hands-on activity where young geometers create trapezoids and calculate their area by looking at areas of quadrilaterals and triangles.


