Curated OER
Obstacles to Success: Misleading Data
Eleventh graders explore how data reported by country agencies can mislead the public intentionally or unintentionally. In this Cross Curricular activity, 11th graders analyze charts and graphs in order to draw conclusions. Students...
Curated OER
The Bigger they Are . . .
Students do a variety of data analyses of real-life basketball statistics from the NBA. They chart and graph rebounding, scoring, shot blocking and steals data which are gathered from the newspaper sports section.
Curated OER
M&M Exponential Activity
Students create a scatter plot of their experimental data. In this algebra lesson, students use M&M's to determine an algebraic model. They discuss results in class.
Texas Education Agency
Texas Gateway: Interpreting Scatterplots
Given scatterplots that represent problem situations, the student will determine if the data has strong vs weak correlation as well as positive, negative, or no correlation.
Texas Instruments
Texas Instruments: Scatterplots and Correlation With Ti 89
Students input data relating the values of one variable associated with values of another and use these data to generate a scatterplot. From the scatterplot, they determine whether there is a correlation between the two variables and...
Other
Nearpod: Scatterplots, Correlation & Lines of Best Fit
In this lesson on scatterplots, young scholars will learn how to create the line of best fit and analyze scatterplots by learning about correlations and causation.
Khan Academy
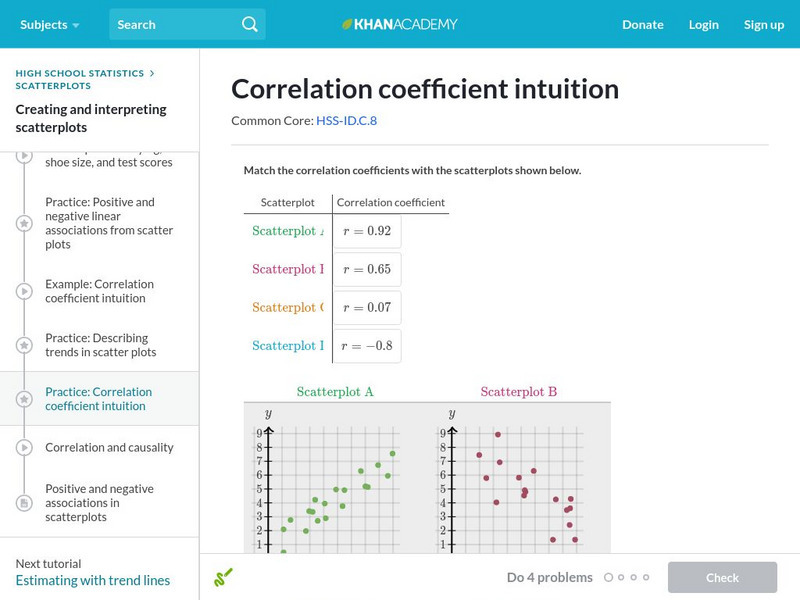
Khan Academy: Correlation Coefficient Intuition
Match correlation coefficients to scatterplots to build a deeper intuition behind correlation coefficients. Students receive immediate feedback and have the opportunity to try questions repeatedly, watch a video or receive hints.
CK-12 Foundation
Ck 12: Scatter Plots and Linear Correlation Grades 11 12
[Free Registration/Login may be required to access all resource tools.] This Concept introdices scatterplots and linear correlation for bivariate data.
Khan Academy
Khan Academy: Correlation Coefficient Review
The correlation coefficient r measures the direction and strength of a linear relationship. Calculating r is pretty complex, so we usually rely on technology for the computations. We focus on understanding what r says about a scatterplot.
Texas Instruments
Texas Instruments: Scatterplots and Correlation With Ti 83
Students learn how to enter a list of data and use these lists to graph two-variable statistics. They learn how to analyze the resulting scatterplots to assess the correlation between two variables.
Khan Academy
Khan Academy: Scatterplots and Correlation Review
A scatterplot is a type of data display that shows the relationship between two numerical variables. Each member of the dataset gets plotted as a point whose x-y coordinates relates to its values for the two variables.
Khan Academy
Khan Academy: Describing Scatterplots (Form, Direction, Strength, Outliers)
Description and example of a scatter plot.
Rice University
Hyper Stat Online Statistics Textbook: Chapter 3: Describing Bivariate Data
This chapter of an online textbook begins with a description of scatterplots, then focuses on the Pearson Product Moment Correlation.
Illustrative Mathematics
Illustrative Mathematics: S Id.6 Used Subaru Foresters
Help Jane sell her Forrester! Using the data given, students will make an appropriate plot with well-labeled axes that would allow you to see if there is a relationship between price and age and between price and mileage. Students are...
PBS
Pbs Teachers: In a Heartbeat [Pdf]
Apply knowledge of scatter plots to discover the correlation between heartbeats per minute before and after aerobic exercise.


