Texas Instruments
Convergence of Taylor Series
Learners analyze taylor series for convergence. In this calculus lesson, students analyze the graph of a taylor series as it relates to functions. They use the TI calculator to graph and observe the different series.
Curated OER
Polar Graphs
Students graph polar graphs. In this calculus lesson, students convert between polar and rectangular coordinates. They graph their solution on the TI calculator and make observations.
Curated OER
Parametric Races & Slopes
Learners investigate the slopes and parametric equations. In this calculus lesson, students solve parametric equations with specific parameters. They relate lines and slopes based on the derivative of the equation.
Texas Instruments
Variables and Expressions
Students solve equations by writing expressions. In this algebra lesson, students identify the different values for each variable. They use the navigator to see how to solve equations.
Curated OER
Distributive Property
Students solve problems using distribution. In this algebra lesson plan, students factor equations using the distributive property. They graph their solution on a graph.
Curated OER
Checking Equivalence
Learners solve equations. In this calculus instructional activity, students compare equations and identify equivalencies. They compare and approximate fractions and decimals.
Curated OER
From Expressions to Equations
Learners differentiate between expression and equation by evaluating integers and observing the difference. They use the TI to see the steps to solve problems.
Curated OER
Using Tables to Solve Linear Functions
Oh that intercept! Budding algebra masters solve linear equations from standard to intercept form. They identify the slope and y-intercept to help graph the lines, an then create coordinate pairs using a table of values. Great TI tips...
Curated OER
Points on a Line
How do you find slope? You use points on a line of course. slope. Teach your class how to calculate and differentiate between horizontal and vertical lines. They are sure to be pros at graphing lines on a coordinate plane by the end of...
Curated OER
Horizontal and Vertical Lines
Learners solve equations and graph-their solutions. For this algebra lesson, students, identify the type of line using the slope of the equation. They graph and observe their lines.
Curated OER
Dog Days or Dog Years?
In need of some algebraic fun with real world implications?Learners use ordered pairs, a table of values and a scatter plot to evaluate the validity of several real world data sets. The class focuses on dog ages in human...
Curated OER
Rate of Change
Students observe and calculate slopes. In this algebra activity, students graph equations and determine the pace at which the slope is changing. They use the navigator to see the change as they graph the lines around.
Curated OER
Multiple Representations
Every topic or subject has its own special jargon. Learners work on their math vocabulary as it relates to basic algebra terms. They define and identify function, functional notation, ordered pairs, rate of change, slope,...
Curated OER
Simple Inequalities on a Number Line
Students solve inequalities problems. In this algebra lesson plan, students graph the solution of inequalities on a number line. They discuss boundaries and open or closed intervals.
Curated OER
Exploring Graphs of Inequalities
Learn how to solve inequalities and graph their answers. Students use addition, subtraction, multiplication and division to solve problems. They analyze their graph using the TI calculator.
Curated OER
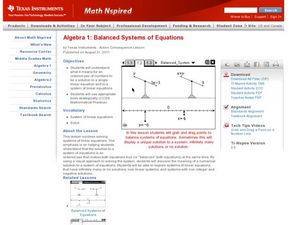
Balanced Systems of Equations
Students solve equations. In this algebra lesson, students relate solving equations to a balanced scale. They add, subtract, multiply and divide on both sides to keep the scale balanced.
Curated OER
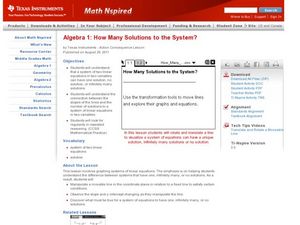
How Many Solutions to the System?
Solve systems of equation using graphing! In this algebra lesson, students use the TI to graph two lines and identify the number of solutions. They perform interactive graphing on the navigator.
Curated OER
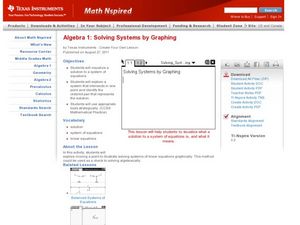
Solving Systems by Graphing
Solve systems of equations with your super smart upper graders. They solve systems of equations and then graph two lines to find where they intersect. The focus on the activity is to have learners explore moving a point to...
Curated OER
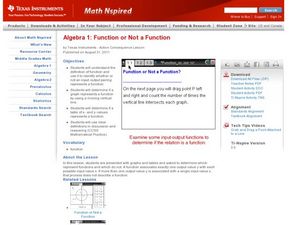
Function or Not a Function
Graphing linear equations on the TI is easy! Through examination of graphs and identification if it is a function or not, this lesson can relate to the real world.
Curated OER
Transformations of Functions 1
Learn how to solve problems with transformation. Learners perform transformation on their graphs. Then, they use the TI to create a visual of the graph as it is moving along the graph.
Curated OER
Transformations of Functions 2
Solving problems on the TI graphing calculator can be quite easy. Young scholars observe the properties of transformation of functions and create a formula for the transformation.
Curated OER
Exploring Transformations
Young scholars investigate functions and their transformations. They move absolute value functions around on the coordinate plane, and then define the transformation and plot the new graph. The table feature of the TI-calculator is used...
Curated OER
Cell Phone Range
Here is a 15 minute activity that can be used as review, a warm, or as a quick example of how to relate functions to the real world. Learners complete an application activity and draw conclusion about functions then discuss open and...
Curated OER
Factoring Trinomials
Have the class factor and solve trinomials of integers in the form x2 + bx + c, where b and c are positive. They relate factoring to area and then follow a specific format to factor their trinomials. Tiles are used to help them...
Other popular searches
- Geography Country Reports
- Country Reports Poster
- Student Country Reports
- Passport Country Reports
- Asia Country Reports
- Asian Country Reports
- Research on Country Reports
- Multimedia Country Reports
- Country reports.org


