Curated OER
Graphing Data
Second graders examine how to make and read bar graphs. In this bar graph lesson, 2nd graders compare bar graphs to pictographs by looking at hair color survey data. They practice making a bar graph and finding the range of the data.
Curated OER
Creating and Analyzing Graphs of Tropospheric Ozone
Students create and analyze graphs using archived atmospheric data to compare the ozone levels of selected regions around the world.
Curated OER
Algebra: Do You See What I See?
Students discover how to find the mean, median, and mode from sets of data. By using statistical techniques such as whisker plots and bar graphs, they display the data gleaned from problems. Individually, students complete projects...
Curated OER
Patterns In Hexagon Tables
Sixth graders construct a rule about the number of sides found in a pattern of hexagons. In this mathematical problem solving lesson, 6th graders observe different hexagon patterns and create a rule about the relationship between the...
Curated OER
Biocomplexity Lab Activity: Creating Salt Water
The lesson seeks to intorduce to students the properties of salt water and how to create salt water. Teacher gives backgound information about salt water to students. From that point, students dscuss what elements are in salt water....
Curated OER
Regions of the United States
Fifth graders collect data about regions of the United States using the Internet, library books, and encyclopedias. They write an essay persuading people to visit their state.
Curated OER
Barrier Islands
Third graders explore how barrier islands work. In this erosion lesson, 3rd graders create barrier islands in stream tables and simulate wave action to see how it affects their island.
Curated OER
Making Sounds
Students perform three experiments to gain understanding of how pitch changes. In this sound lesson, students create a variety of sounds with different pitches. Students will record their data as the observe the differences in the sounds...
Curated OER
Patterns and Functions
Learners investigate properties of perimeter and area. In this middle school mathematics lesson, students explore patterns in a problem solving context. Learners model and solve problems using various representations for the data as they...
Curated OER
Give Me Some Sugar, Honey!
Students research the history of honey and different products that come from honey. In this bees and honey activity, students review how honey is made, discuss ways people use honey, research the history of honey and its uses, create a...
Curated OER
FOLLOW THAT WATER
Students build simple stream tables and vary the angle of the stream tables in order to simulate different flow rates and compare the results. They observe various features formed in a stream table by flowing water and compare these to...
Curated OER
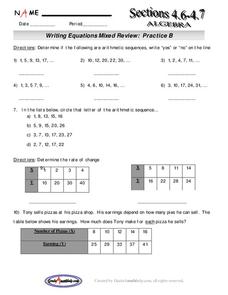
Writing Equations Mixed Review
Learners write equations based on a pattern. In this algebra lesson, students calculate the arithmetic and geometric mean of a sequence. They rewrite word problems as a linear equation and solve real life scenario based on the given data.
Curated OER
Green Food Graph
Students explore graph making by investigating St. Patrick's day food. In this holiday food lesson, students discuss their favorite green foods in honor of St. Patrick's day. Students create a graph based on the data of which green foods...
Curated OER
T's Alive! Or Is It?
Learners explore data on the bone, muscle, and skin of living systems and then create a list of characteristics of these systems and relate these characteristics to bone, muscle, and skin.
Curated OER
Water, Water Everywhere
Learners explore water. In this water absorbency instructional activity, students experiment with different items to see if they absorb water. Learners record their findings on a data sheet. Students then try making music with drinking...
Curated OER
1928 Flu
Students state the some diseases are the result of infection. They describe the risks associated with biological hazards, such as viruses. Pupils name ways that infectious disease can be prevented, controlled, or cured. Students...
Curated OER
Interpreting and creating tables
Young scholars observe examples and discuss how to interpret them. They then
brainstorm examples of possible questions students could use to create a table. They take time to formulate a question and collect data.
Curated OER
Making Money and Spreading the Flu!
Paper folding, flu spreading in a school, bacteria growth, and continuously compounded interest all provide excellent models to study exponential functions. This is a comprehensive resource that looks at many different aspects of these...
Curated OER
How Big Is That Star?
Aspiring astronomers study stars. They compare stars and explain the relationship between radius, mass, and diameter. By creating a star simulation, they discover how a binary star system's orbit can cause changes in the observed...
Curated OER
Genetics
Trace simple genetic patterns of inheritance through a small population. Your students create a family pedigree that traces a genetic condition through several generations.
Curated OER
Math Investigations 2
Young mathematicians practice measuring and graphing skills while working in groups to measure objects found in the classroom. Using their measurements, they create one bar graph displaying the lengths and another displaying the widths.
Curated OER
Estimating the Mean State Area
Seventh grade statisticians randomly select five states and then determine the mean area. The class then works together to create a dot plot of their results.
Curated OER
Exploration of 'pill bugs'
Fifth graders define words. They create a dichotomous key. After carefully examining pill bugs, 5th graders record observations. They compare and contrast habitats of pillbugs.
PwC Financial Literacy
Income and Careers: Career Exploration
Elementary schoolers take part in a virtual career day and are exposed to various career opportunities in the finance, education, and medical fields. By accessing a video you can download from the PwC Financial website, learners "shadow"...


