Curated OER
How Big Is That Star?
Aspiring astronomers study stars. They compare stars and explain the relationship between radius, mass, and diameter. By creating a star simulation, they discover how a binary star system's orbit can cause changes in the observed...
Curated OER
Genetics
Trace simple genetic patterns of inheritance through a small population. Your students create a family pedigree that traces a genetic condition through several generations.
Curated OER
Math Investigations 2
Young mathematicians practice measuring and graphing skills while working in groups to measure objects found in the classroom. Using their measurements, they create one bar graph displaying the lengths and another displaying the widths.
Curated OER
Estimating the Mean State Area
Seventh grade statisticians randomly select five states and then determine the mean area. The class then works together to create a dot plot of their results.
Curated OER
Exploration of 'pill bugs'
Fifth graders define words. They create a dichotomous key. After carefully examining pill bugs, 5th graders record observations. They compare and contrast habitats of pillbugs.
PwC Financial Literacy
Income and Careers: Career Exploration
Elementary schoolers take part in a virtual career day and are exposed to various career opportunities in the finance, education, and medical fields. By accessing a video you can download from the PwC Financial website, learners "shadow"...
Curated OER
Saving Energy Through Ecological Landscape Design
Students are able to transcribe to scale the plant features of a common landscape. They determine true north and south and collect and record data on a table. Students calculate a rating for and describe a definition of insulation and...
Curated OER
Marvelous Magnets
Students identify and classify magnetic and nonmagnetic materials and metals. After determining which materials and metals are magnetic, students create a data table and classify items by two different criteria. Students e-mail various...
Curated OER
How Do Clouds Affect Radiative Energy
Learners graph the upwelling and downwelling of shortwave radiation. They create a data table with the information. Students compute the Watts per square meter. They discuss their results and whether or not cloud type affects daily...
Curated OER
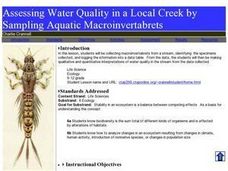
Assessing Water Quality in a Local Creek by Sampling Aquatic Macroinvertabrets
Learners experiment collecting macroinvertebrates from a stream and identify the specimens collected and then log in the information into a data table. From the data, they make qualitative and quantitative interpretations of water quality.
Curated OER
Environmental Graphing
Young scholars experiment with graphing. In this graphing introduction lesson plan, students complete four activities: 1) a bar graph based on class birthdays 2) an estimation graph of the raisins in raisin bread 3) another estimation...
Curated OER
Lab Activity: Model of the Planets
This worksheet leads the class through the calculations needed to construct circles to represent the planets of our Solar System. The actual values are provided, as are suggested calculations to create the scale diameters. The ten...
Laboratory for Atmospheric and Space Physics
Planetary Distances on the Playground
There's no need to stay inside; get out of the classroom and create a scaled map of the solar system on your playground field! In collaborative groups, scholars identify the distance between the sun and other planets, place planet...
University of Colorado
Planetary Distances on the Playground
Earth is 149,600,000 km, or 92,957,130.4 miles, from the sun. Young astronauts create an interactive model to learn the distances between planets. Nine groups, each representing a different planet, are spread around at class-calculated...
Curated OER
Measurement: When Degrees Matter
Eighth graders record the temperature change of the beakers. In this general science lesson, 8th graders create their own data table for recording observations. They discuss experimental results and cite real life applications.
Curated OER
Self Portrait, What Nerve!
Students conduct an experiment to determine the distance between touch receptor fields in parts of the right-hand side of the body. They enter data into the data table.
Curated OER
What are the Issues?
Seventh graders complete political analysis activities. In this political analysis lesson, 7th graders discuss party platforms and research party issues for their party's candidate's positions. Students complete an issues organizer and...
Curated OER
What Days Are the Busiest in the Maternity Ward?
Students form a conclusion using statistical data. In this statistical data lesson plan, students collect and analysis data to form a conclusion about what day of the week most babies are born.
Curated OER
A Look at the Population Density of the United States
Students acquire census information and create maps of the population density of the United States on different scales. They role play the roles of workers of a retail company and they use the population data to market to their customers.
Curated OER
Iron Oxide Lab: Incorporating Math and Science
Students conduct an experiment in small groups, draw conclusions about the amount heat of a compound achieves and practice their data analysis skills.
Curated OER
Pecan Power
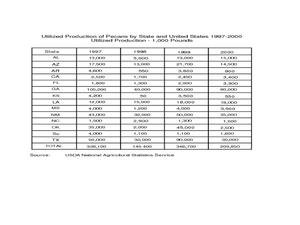
Young scholars study the origins of pecans and complete a bar graph from the data they have discovered. In this pecan lesson plan, students draw pecans, discuss a pecan time line, and draw a bar graph comparing Arizona pecans to other...
Curated OER
Creating a Nutrition Table in MicroSoftExcel
Students access the internet to find Nutritional information from a restaurant of their choice and compile their information into an excel spreadsheet.
Curated OER
Kansas Foods A Data and Probability Investigation
Students study a number of food products and anticipate which are derived from Kansas crops. They make a list of words associated with the food stuffs and graph the results.
Curated OER
Chemical Reaction of Carbonate Rocks and Acids
Students complete an investigation into the chemical reaction that occurs between carbonate rocks and acids. Working in groups, students design and conduct their investigation. They create a data table detailing their results. Results...


