Curated OER
Line Graphs
Seventh graders create a line graph and identify when to use line graphs. In this line graphs lesson, 7th graders analyze the average temperatures of various cities. Students graph the data they collected.
Curated OER
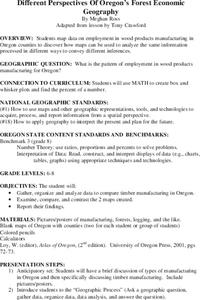
Different Perspectives of Oregon's Forest Economic Geography
Students locate the many forests located in Oregon. In groups, they use the internet to research employment data on wood products made in the state. They discuss how looking at information presented in a different way can change their...
Curated OER
Technology Integration Lesson Plan - Comparison of Texas Counties
Students identify physical and human characteristics used to describe a desirable place to live. They research and create a table comparing 5 Texas counties according to specific characteristics. Students evaluate the data and choose the...
Curated OER
State Economy Chart
Fifth graders create a 3D Pie graph using the Chart Wizard in Excel to represent their assigned states' data. They discuss the similarities and differences between states, and form a hypothesis on the relationship between location and...
Curated OER
Streamflow
Learners discuss the topic of streamflow and how it occurs. They take measurements and analyze them. They interpret data and create their own charts and graphs.
Curated OER
Hermit Crab Races
Students predict the speeds of humans and hermit crabs and investigate their predictions using ratios and formulas. AppleWorks is used for this lesson, which includes a data worksheet.
Curated OER
Asthma "Outbreak" Exercise
Students investigate numerical data on a possible asthma epidemic. Using statistical information, students graph and figure ratios of the epidemic. They evaluate the mortality rate from severe smog in the 1950's in London.
Curated OER
Atlatl Lessons
Fifth graders study math patterns and relationships as well as learn about the heritage of Aboriginal peoples of Saskatchewan. In this patterns and heritage lesson, 5th graders research the daily lives of First Nations People in...
Curated OER
Locating the Salt Front
Learners use Hudson River salinity data to create a line
graph that shows the location of the salt front, and use math
skills to explore how this location varies over time. They use the graph to estimate the location of the salt front...
Curated OER
Rock Identification Lab
Eighth graders compare and contrast the three different types of rock. In this earth science lesson, 8th graders classify rock samples according to their correct rock type. They design their own data collection table.
Curated OER
A Real Difference
Fifth graders use the Celsius and Fahrenheit thermometers to compare temperature readings. They use the Internet to find the temperatures of selected cities. After data is collected for five days, 5th graders graph the temperatures.
Curated OER
The Ghost of Populations Past
Students study population distribution and survivorship curves by collecting data regarding age of death of humans from either tombstones, newspapers, or other community resources. Students analyze data by creating graphs and population...
Curated OER
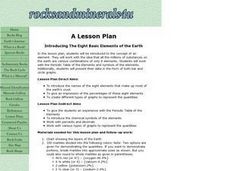
Eight Basic Elements of the Earth
Students identify the concept of an element and work with an idea that all of the millions of substances on the earth are various combinations of only 8 elements. They work with the Periodic Table of the Elements and symbols of the...
Curated OER
Lift vs. Airspeed
Young scholars, after reading the explanation given below, use FoilSim and a graphing calculator to complete the activity to determine the relationship between airspeed and lift of an object by interpreting data.
Curated OER
Planet Earth
Students explore and analyze data from different maps in order to explain geographic diversity among the continents. Student groups research continents' physical features and examine how they contribute to quality of life for inhabitants.
Curated OER
What's Cooking at the Good Times Cafe?
Students collect data from classmates showing their favorite lunch food. They enter their data and graph the results using a computer program.
Curated OER
Pepe Cleaners
Seventh graders gather data to determine the relationships between the base and height of rectangles with fixed perimeters and express the relationships using words and symbols. Students build rectangles with pipe cleaners. They create...
Curated OER
How Are Students Doing on the AP exams?
Students compile and analyze data pertaining to College Credit AP Exams. They pose questions - Which exam is the easiest? - determine answers from their data and display their results.
Curated OER
Bubbles
Students complete experiments with three different bubble solutions to determine which one creates the largest bubbles. Before conducting the experiments, they discuss the ingredients in each solution, and make predictions on which will...
Curated OER
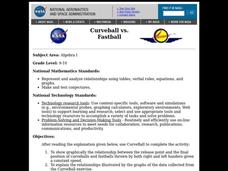
Curveball vs. Fastball
Students graph the relationship between the release point and the final position of curveballs and fastballs thrown by both right and left handers given a constant speed, and explain the relationships illustrated by the graphs of data.
Curated OER
Tracking Weather Over Time
Students gather, analyze and interpret data. They explain scientific inquiry. They plot points on a map and report information from a spatial perspective.
Curated OER
Budgeting 101
Students identify various sources of income and discern between needs and wants as they also learn to create a personal budget. In this personal budget lesson, student understand financial scenarios as they relate to different ways...
Curated OER
The Effects of Light Intensity and Wavelength on the Rate of Photosynthesis
Students use an on line website to simulate the effects of light intensity and wavelength on photosynthesis. In this photosynthesis lesson plan, students determine how wavelength of light and intensity of light affect the rate at which...
Curated OER
Ice Cream Pictograph
Students create a graph. In this pictograph lesson plan, students cut out 20 small ice cream cones and decorate them. Students create a pictograph with their ice cream cones.


