Curated OER
Blast Off
In this physical science exploration, small groups place a piece of antacid tablet into a film canister and step back to time how long it takes for the top to pop. They repeat the activity, altering either the amount or temperature of...
Curated OER
Measurement: Stream Flow & Stadium Capacity
Eighth graders study the scientific fields and how information can be monitored and recorded. For this scientific inquiry lesson students view a PowerPoint presentation and complete a hands on activity.
Curated OER
And the Winner Is...
Third graders participate in an election project. They collect data to create a spreadsheet from which a graph is generated.
Curated OER
Make Your Own "Weather" Map
High schoolers create their own "weather" map using data from x-ray sources. They analyze and discuss why it is important to organize data in a fashion in which is easy to read. They compare and contrast different x-ray sources using a...
Curated OER
The Effects of Environment on Plant Growth: Selecting Seeds for Survival on a New Planet
Fifth graders conduct experiments to compare seed germination and plant growth rates. They construct a hydroponic plant unit and a lighthouse. They care for the plants for a month and collect data for graphs. They write a report.
Curated OER
Firewood Problem
Students write and solve their own story problems. They determine the cost of firewood by the cord. They organize their data in graphs and charts.
Curated OER
Recording Frequency
First graders analyze nursery rhymes and gather data about word frequency. In this frequency lesson, 1st graders create graphs and tables. Students interpret the data.
Curated OER
The Effects of Light Intensity and Wavelength on the Rate of Photosynthesis
Students use an on line website to simulate the effects of light intensity and wavelength on photosynthesis. In this photosynthesis lesson plan, students determine how wavelength of light and intensity of light affect the rate at which...
Curated OER
Math Journal: Functions and Coordinate Geometry
Fifth graders examine the many uses of coordinate grids. In this graphing lesson, 5th graders write data driven equations, discuss the x and y-axis, and determine if using 2 or 3 ordered pairs is better. Students complete several...
Curated OER
Lifting a Load
Students experiments with levers to determine if the amount of force needed to lift a load is always the same. For this physics lesson, students use Lab-Pro data collector as they experiment with the fulcrum placement to measure the work...
Curated OER
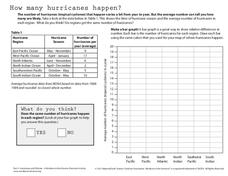
How Many Hurricanes Happen?
In this hurricanes instructional activity, students use a data table showing the hurricane region and the average number of hurricanes per year to determine if the same number of hurricanes happen in each region by creating a graph. Then...
Curated OER
Statistics with State Names
Students analyze the number of times each letter in the alphabet is used in the names of the states. In this statistics lesson, students create a stem and leaf plot, box and whisker plot and a histogram to analyze their data.
Curated OER
Giant Mystery
Third graders determine the relationship between hand size and body size using centimeters as the unit of measure, They use the relationship to find the size of a hypothetical giant. They graph the measurements using a spreadsheet program.
Curated OER
Jelly Bean's Galore
Young scholars investigate the origins of the Jelly Bean. They complete a Scavenger Hunt using the jellybean website. Pupils create a bar graph using information collected about jelly beans. Students discuss the time of year that Jelly...
Curated OER
Boyle's Law
In this Boyle's Law worksheet, students investigate the relationship between the pressure and the volume of a gas at constant temperature. They use a syringe and a pressure gauge attached to a computer to collect their data. They create...
Curated OER
U.S. Post Office Mural Walking Tour
Students discover a sense of community by examining Post Office murals located in cities and small towns throughout the United States. They explore the significance of the murals by contacting and communicating with local Postmasters....
Curated OER
Spaghetti Bridges: Student Worksheet
In this math worksheet, students will create a "bridge" out of spaghetti and test it's strength with pennies. Students will record their results on a table and then graph the results.
Curated OER
Yummy Apples!
Students discuss apples and how they are grown. They listen as the teacher reads "Apples," by Gail Gibbons. Students discuss the story. They view several different types of apples and compare their characteristics. Students taste several...
Curated OER
Pendulum Lab in 9th Grade Physical Science
Ninth graders conduct experiments to determine what affects the rate of a pendulum's swing. Working in small groups, they identify an independent variable to study and create an experiment to test their hypothesis. When tests are...
Curated OER
How is a Star's Color Related to Its Temperature?
In this star color and temperature worksheet, students create a Hertzsprung-Russell diagram in order to determine how star brightness, color, temperature, and class are related. Once diagram is complete, they answer 6 short answer...
Curated OER
Career Exploration
Students complete a unit about career choices. They conduct research on a selected career that interests them, conduct an interview, explore various websites, create a five-page HyperStudio stack, and write ten checks that relate to...
Curated OER
1928 Flu
Students state the some diseases are the result of infection. They describe the risks associated with biological hazards, such as viruses. Pupils name ways that infectious disease can be prevented, controlled, or cured. Students...
Curated OER
How Do You Spend Your Time?
Pupils keep records and determine how much time they spend on certain activities. They insert the data into a spreadsheet. Students graphically display data in a bar graph and a circle graph.
Curated OER
Mathematics Within: Algebraic Patterns
Students discover patterns in linear equations by playing a dice game to collect data. They graph the data and analyze the patterns of the lines created by the data. The class then compares the individual graphs to evaluate the position...


