Curated OER
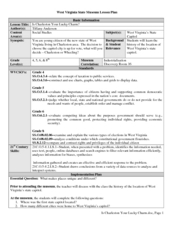
Is Charleston Your Lucky Charm?
Students determine what makes Charleston, West Virginia unique. In this West Virginia history lesson plan, students explore the West Virginia History Museum to identify why Charleston became the capitol of the state.
Curated OER
Discovering the Oregon Trail
Students explore U.S. history by researching the Oregon Trail. In this American exploration lesson plan, students read the story On the Shore of the River and define the exact path early settlers took to find the state of Oregon....
Curated OER
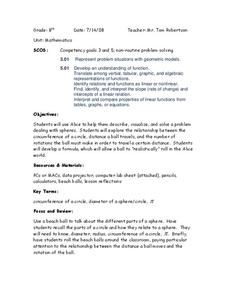
Circle Relationships
Students explore circles. In this geometry instructional activity, students explore the relationship between the circumference of a circle, the distance a ball travels, and the number of rotations the ball must make in order to travel a...
Curated OER
Pizza Topping Combinations
Learners brainstorm pizza toppings and determine the number of possible ways to order a pizza. In this algebra activity, students analyze and investigate geometric patterns as they relate to the concept of a variable. Learners then use a...
Curated OER
1960 Election
Learners examine the election of 1960. For this US politics lesson students listen to a teacher driven lecture, take notes, engage in a class discussion and write a response to what they have learned regarding the 1960's presidential...
Curated OER
Making Sense of the Census
In this unit of lessons, students make sense of the census. They examine why a census is taken and participate in activities.
Curated OER
The Talking Earth: a Research Lesson
Fifth graders read the book, "The Talking Earth" and research an animal that is found in the Everglades.
Curated OER
Japan: A Cultural Study
Third graders "take a trip" to Japan. They discover what life is like for a typical Japanese child and compare/contrast it to life in America. They give an oral presentation of Japanese holidays and festivals.
Better Lesson
Better Lesson: Class Surveys and Graphs
Students love graphing data that they "own". In this plan, the class will select a type of graph and create it using a class survey frequency table. Included in this activity are videos of the class engaged in the activity and samples of...
Alabama Learning Exchange
Alex: Getting to Know Your Classmates Using Bar Graphs
Students will collect data from class using surveys. Students survey classmates concerning favorite movies, favorite color, shoe size, time spent studying, brand of cell phone and etc. From the data they will create bar graphs using an...
Better Lesson
Better Lesson: Going for the Gold
Second graders read and create graphs based on Olympic data for 2014.
Alabama Learning Exchange
Alex: Representing Possibilities
The students will work through problems that will be represented in tables, equations, and graphs. This lesson was adapted from NCTM Student Math Notes, May/June 2007.This lesson plan was created as a result of the Girls Engaged in Math...
Alabama Learning Exchange
Alex: My Peanut Butter Is Better Than Yours!
The students will engage in the process of statistical data comparing data using tables and scatterplots. The students will compare data using measures of center (mean and median) and measures of spread (range). This lesson can be done...


