Curated OER
Japan: A Cultural Study
Third graders "take a trip" to Japan. They discover what life is like for a typical Japanese child and compare/contrast it to life in America. They give an oral presentation of Japanese holidays and festivals.
Khan Academy
Khan Academy: Creating Frequency Tables
Practice creating frequency tables from small data sets. Students receive immediate feedback and have the opportunity to try questions repeatedly, watch a video or receive hints.
Khan Academy
Khan Academy: Calculating the Median: Data Displays
Practice computing the median of data sets presented in a variety of formats, such as frequency tables and dot plots. Students receive immediate feedback and have the opportunity to try questions repeatedly, watch a video or receive hints.
Better Lesson
Better Lesson: Class Surveys and Graphs
Students love graphing data that they "own". In this plan, the class will select a type of graph and create it using a class survey frequency table. Included in this activity are videos of the class engaged in the activity and samples of...
Alabama Learning Exchange
Alex: Getting to Know Your Classmates Using Bar Graphs
Students will collect data from class using surveys. Students survey classmates concerning favorite movies, favorite color, shoe size, time spent studying, brand of cell phone and etc. From the data they will create bar graphs using an...
University of Cambridge
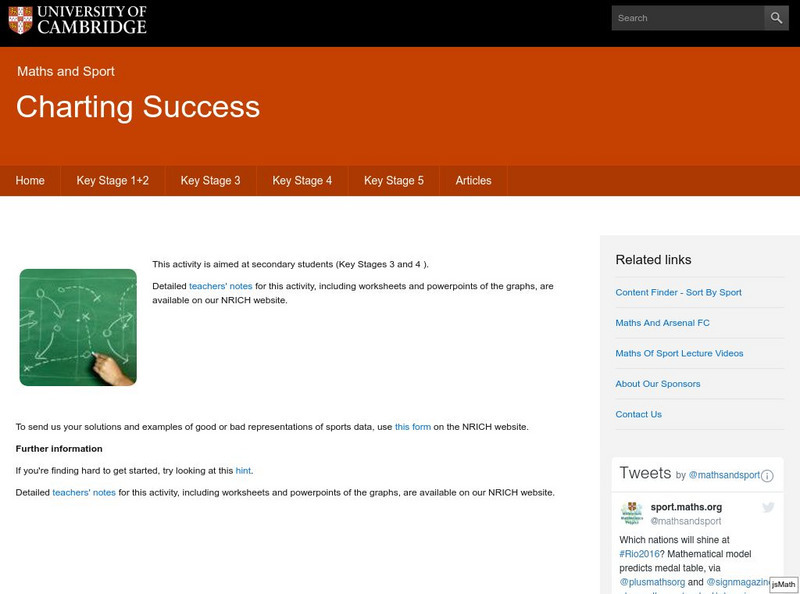
University of Cambridge: Maths and Sports: Charting Success
Sports statisticians, trainers and competitors create graphs, charts and diagrams to help them to analyse performance, inform training programmes or improve motivation. This activity encourages students to consider and analyse...
Texas Instruments
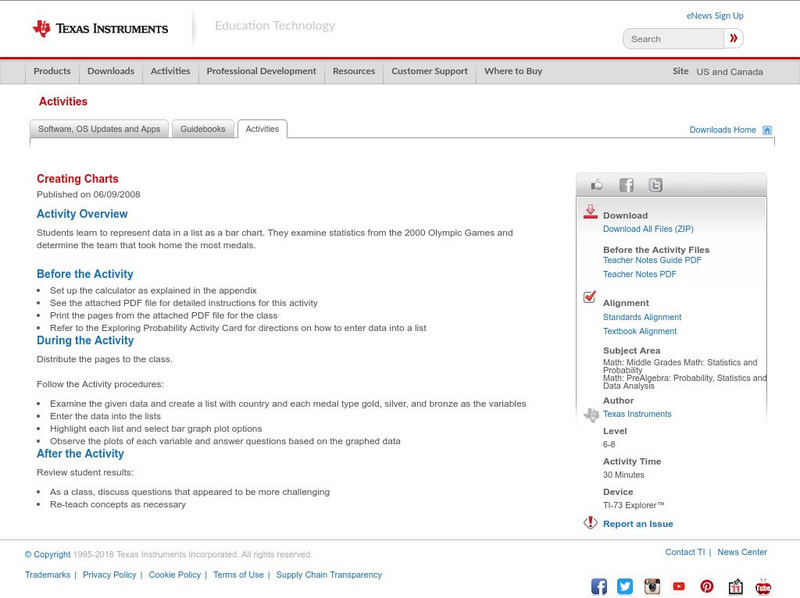
Texas Instruments: Creating Charts
Students learn to represent data in a list as a bar chart. They examine statistics from the 2000 Olympic Games and determine the team that took home the most medals.
Better Lesson
Better Lesson: Going for the Gold
Second graders read and create graphs based on Olympic data for 2014.
Rice University
Rice University: The Hand Squeeze
Students will enjoy this data collection and class analysis experiment involving the time it takes for a hand squeeze to travel around a circle of people. From organizing the activity to collecting the data to making a table and graphing...
Varsity Tutors
Varsity Tutors: Hotmath: Practice Problems: Circle Graphs
Two problems present practice creating a circle graph from a data table. Both are given with each step to the solution cleverly revealed one at a time. You can work each step of the problem then click the "View Solution" button to check...
Alabama Learning Exchange
Alex: Representing Possibilities
The students will work through problems that will be represented in tables, equations, and graphs. This lesson was adapted from NCTM Student Math Notes, May/June 2007.This lesson plan was created as a result of the Girls Engaged in Math...
TeachEngineering
Teach Engineering: Energy Perspectives
Students utilize data tables culled from the US DOE Energy Information Agency to create graphs that illustrate what types of energy we use and how we use it. An MS Excel workbook with several spreadsheets of data is provided. Students...
Alabama Learning Exchange
Alex: My Peanut Butter Is Better Than Yours!
The students will engage in the process of statistical data comparing data using tables and scatterplots. The students will compare data using measures of center (mean and median) and measures of spread (range). This lesson can be done...
Purple Math
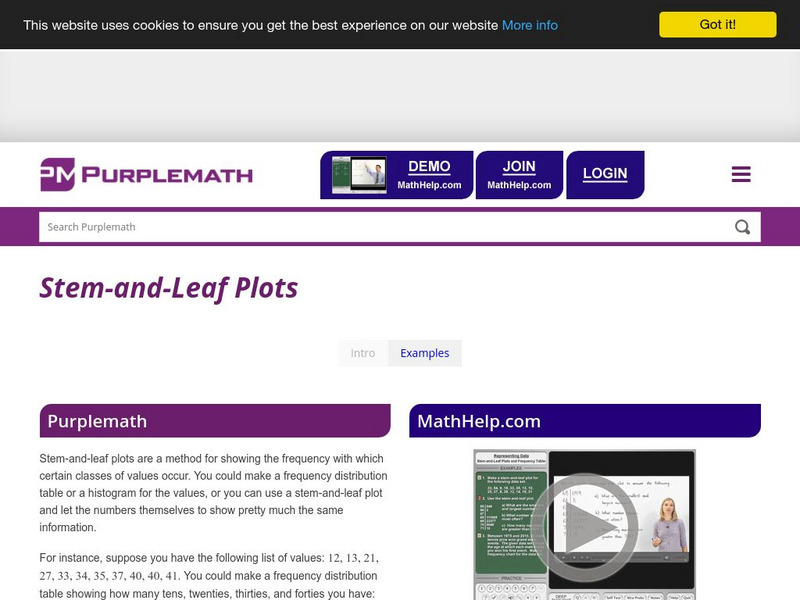
Purplemath: Stem and Leaf Plots
Explains how to create a stem-and-leaf plot from a data set. Demonstrates how to format a clear stem-and-leaf plot.
TeachEngineering
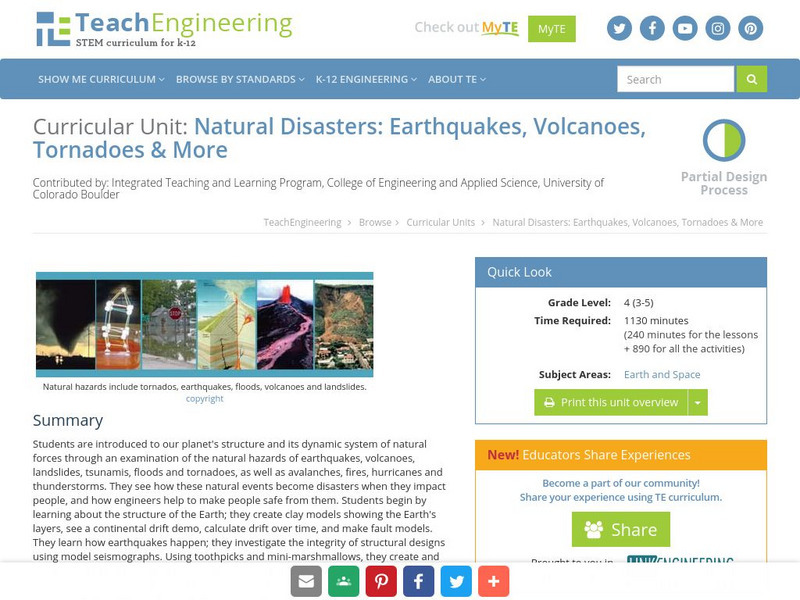
Teach Engineering: Natural Disasters
Students are introduced to our planet's structure and its dynamic system of natural forces through an examination of the natural hazards of earthquakes, volcanoes, landslides, tsunamis, floods and tornados, as well as avalanches, fires,...


