Curated OER
African Savannah
Pupils are read two African fairy tales. Using the text, they create a map and key for each region mentioned. They compare and contrast the various communities and discover how geographic features affect how people live.
Curated OER
Persuasive Letters and The Tell Tale Heart
Pupils write persuasive letters based on "The Tell Tale Heart." They brainstorm topic sentences, main ideas, and details. They analyze the character and determine if he is innocent or guilty. They create a map listing their reasons to...
Noyce Foundation
Photographs
Scaling needs to be picture perfect. Pupils use proportional reasoning to find the missing dimension of a photo. Class members determine the sizes of paper needed for two configurations of pictures in the short assessment task.
Inside Mathematics
Coffee
There are many ways to correlate coffee to life, but in this case a worksheet looks at the price of two different sizes of coffee. It requires interpreting a graph with two unknown variables, in this case the price, and solving for those...
Inside Mathematics
Expressions
Strive to think outside of the quadrilateral parallelogram. Worksheet includes two problems applying prior knowledge of area and perimeter to parallelograms and trapezoids. The focus is on finding and utilizing the proper formula and...
Safe Routes to School
Pollution & Evolution
Bring together a study of two major scientific topics with a lesson on the relationship between pollution and evolution. With the help of a PowerPoint presentation, hands-on activity. and class demonstration young scientists learn how...
Inside Mathematics
Hexagons
Scholars find a pattern from a geometric sequence and write the formula for extending it. The worksheet includes a table to complete plus four analysis questions. It concludes with instructional implications for the teacher.
Inside Mathematics
Vencent's Graphs
I like algebra, but graphing is where I draw the line! Worksheet includes three multiple-part questions on interpreting and drawing line graphs. It focuses on the abstract where neither axis has numbers written in, though both are...
California Education Partners
Speedy Texting
Model the effects of practice on texting speed. Pupils develop a linear equation that models the change in texting speed based on the amount of practice. The sixth performance task in an eight-part series requires learners to solve and...
Curated OER
Road Trip
Students create PowerPoint presentations on destinations researched on the Internet.
Curated OER
Striking Zone
Students review the states and their capitols. On the teachers signal, each student use their hand or a paddle to strike the ball in different ways towards the wall. When the ball hits a state, students recite the capitol of that state.
Curated OER
On the Road
Students create a diorama to illustrate the challenges of and requirements for long distance travel in the West before the coming of the railroads.
Curated OER
VS.7a
Seventh graders explore, analyze and identify the events and differences between northern and southern states that divided Virginians and led to secession, war and the creation on West Virginia. They discuss the conflicts that developed...
Curated OER
The Lewis and Clark Expedition
Students examine the Lewis and Clark expedition. They develop skills for historical analysis. They locate a variety of geographic features encountered by the expedition, and create a timeline that documents Lewis and Clark on their journey.
Curated OER
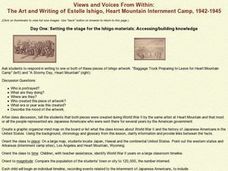
The Art and Writing of Estelle Ishigo, Heart Mountain Internment Camp, 1942-1945
Students view images of the Heart Mountain Internment Camp created by Estelle Ishigo. They discuss the time and place portrayed in the images and create a timeline recording events related to the internment of Japanese Americans.
Curated OER
The Wild Wild Mid-West
Eleventh graders examine reasons for Louisiana Purchase and identify those who played key roles in it, create map of Louisiana Purchase and states that are part of it, and analyze overall importance of Louisiana Purchase.
Curated OER
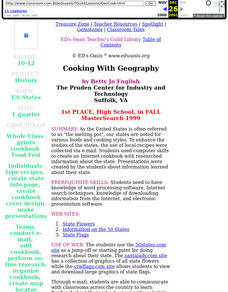
Cooking With Geography
Sstudents use desktop publishing to create "real world" documents from information received from collaborating classes. They create an electronic presentation from Internet research. They experience foods from different states and regions.
Curated OER
Immigration For Grades K-2
Students engage in a lesson about the concept of immigration. They conduct research using a variety of resources. The information is used in order to create context for class discussion or a class presentation topic. They also read...
Curated OER
Study of New York City
Fourth graders read A Cricket in Times Square and examine the essence of living in New York City. They examine subway maps and other resources concerning NYC and then complete several writing activities about the city. They also create...
Curated OER
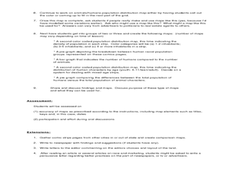
What is the Population Distribution of Cartoon Characters Living On the Pages of Your Newspaper?
Students read various cartoons in their local newspaper and calculate the population demographics, spatial distribution and grouping of the characters. Using this information, they create a population distribution map and share them with...
Curated OER
Naviagational Tools
Fifth graders create a compass, with the help of written instructions and then write six sentences discussing how compasses work and why they are helpful. They discuss the different types of navigational tools and how they are helpful.
Curated OER
A Cowboy's Life
Students observe a photograph of a cowboy and brainstorm things a cowboy would do. They reveiw text about Wyoming and locate facts and information about a cowboys life then create a friendly letter containg key components found in a...
Curated OER
Where in the World is Utah Wheat?
Students examine the role of climate and landforms in the use of Utah's land. In this geography lesson, students analyze the relationship between geography and agriculture in the state as they examine data regarding wheat production in...
Curated OER
Labeling the World
Sixth graders conduct research on the countries found on the labels on their clothing. They locate the countries on a map, research the labor practices on countries that export clothing to the U.S., and create a graph using the information.


