Curated OER
Mathematics Within: Bar And Pie Graphs
Students compare and contrast the use of bar and pie graphs with the same data. They create a data set by surveying all students in the class using sticky notes to make a table on the board. Then, each student creates a bar and pie graph...
Curated OER
The Origins and Maintenance of Earth's Atmosphere
In this atmosphere activity, students read over a data table showing the percentage of carbon dioxide, oxygen and nitrogen in the atmosphere over the last 4500 million years. Students create a graph comparing these gases over time and...
Curated OER
Bar Graph- Calories In Fast Food Items
In this bar graph worksheet, students analyze a bar graph that shows calories in 10 fast food menu items. Students answer 7 questions about the graph.
Curated OER
Technical Literacy
Students explore the components of the transference of technological information through this ten lesson unit. The applications to specific careers, the determination of responsible use of technology, and the affects of technology on...
Curated OER
The Periodic Table
High schoolers research an assigned element using the library, an encyclopedia, the Internet and other appropriate resources in order to write a research paper, a project, and an oral presentation.
Curated OER
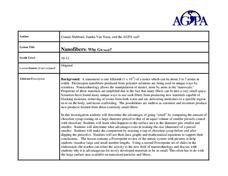
Nanofibers: Why Go Small?
Students explore the surface ratio of an object. In this surface area to volume lesson students construct a data table, make calculations and create a graph.
Curated OER
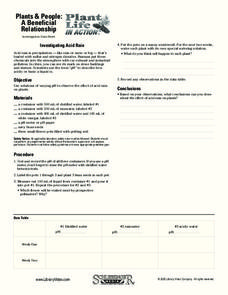
Plant Life In Action
Int his plant worksheet, students folllow the given directions to create an experiment. Students then answer 5 short answer questions and complete the given data table with results for two weeks.
University of North Carolina
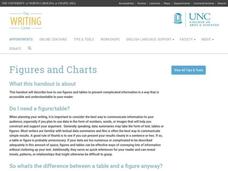
Figures and Charts
Sometimes words aren't the best way to get information across to the reader. The eighth handout in the 24-part Writing the Paper series describes different type of figures and charts to display complex information in a paper....
Inside Mathematics
Winning Spinners
Winning a spin game is random chance, right? Pupils create a table to determine the sample space of spinning two spinners. Individuals determine the probability of winning a game and then modify the spinners to increase the probability...
West Contra Costa Unified School District
Point-Slope Application Problems
Create a linear equation for a problem when the intercept information is not given. The two-day lesson introduces the class to the point-slope form, which can be used for problems when the initial conditions are not provided. Pupils...
EngageNY
More on Modeling Relationships with a Line
How do you create a residual plot? Work as a class and in small groups through the activity in order to learn how to build a residual plot. The activity builds upon previous learning on calculating residuals and serves as a...
02 x 02 Worksheets
Inverse Variation
Discover an inverse variation pattern. A simple lesson plan design allows learners to explore a nonlinear pattern. Scholars analyze a distance, speed, and time relationship through tables and graphs. Eventually, they write an equation to...
Virginia Department of Education
Atomic Structure: Elements
It's all relevant, really. Individuals use the scientific method to learn more about elements, atoms, and their placement on the periodic table. They conduct experiments using materials common in nature to explore how elements affect our...
EngageNY
Writing and Evaluating Expressions—Multiplication and Addition
How many people can sit around a table? The 22nd part in a series of 36 continues the work on writing and evaluating expressions to include expressions with two operations. Pupils use models to determine an expression for the number of...
NASA
Launch Altitude Tracker
Using PVC pipe and aquarium tubing, build an altitude tracker. Pupils then use the altitude tracker, along with a tangent table, to calculate the altitude of a launched rocket using the included data collection sheet.
PACER Center
The Peer Advocacy Guide
Teasing, mocking, and disrespect can be the hallmarks in the life of those with disabilities. Disrupt the cycle of abuse with a toolkit designed to turn peers into advocates for all those who are bullied. Everything needed to create a...
Virginia Department of Education
Isotopes
Lead your class through the amazing world of isotopes as they investigate the various properties they contain and further understand their respective location on the periodic table. They explore half-lives and radioactivity as each...
Howard County Schools
Generous Aunt
Witness the power of exponential growth with an activity that investigates two different savings plans. Class members create tables of values to see how and when a savings plan increasing exponentially exceeds one increasing linearly.
Pingry School
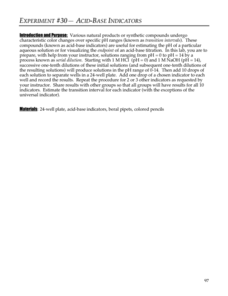
Acid-Base Indicators
Acid-base indicators are an essential part of any chemistry classroom. Individuals explore the color-changing feature of the important indicators in a vibrant hands-on activity. Using serial dilution, learners create solutions ranging...
Curated OER
Plate Tectonics
Help young scientists piece together the theory of plate tectonics with this comprehensive collection of materials. Whether your are looking for worksheets, hands-on activities, or assessments, this resource has everything...
EngageNY
Secant Angle Theorem, Exterior Case
It doesn't matter whether secant lines intersect inside or outside the circle, right? Scholars extend concepts from the previous lesson to investigate angles created by secant lines that intersect at a point exterior to the circle....
Curated OER
Modeling Linear Relationships
Students graph lines using the slope and y-intercept. In this algebra lesson, students create data using tables and equations. They use their data to make predictions and draw conclusion.
Curated OER
Pizza Possibilities
Pupils create and interpret line plots, bar graphs, and circle graphs. The lesson assumes mastery of conversions from fraction to decimal to percent, construction of angles, and at least an introduction to graphs displaying data.
Curated OER
Investigation - Looking For Triangles
Seventh graders investigate a series of triangles, looking for patterns and generalizing what they have found. They analyze the pattern data and organize it into a table and graph. Students identify the relationship and discover the rule...


