Curated OER
Making Connections
Seventh graders relate patterns with higher math. In this 7th grade math lesson, 7th graders analyze different methods of portraying data. They relate the data to real life scenarios.
Curated OER
Altering a Plant Environment
Students investigate what a controlled group is by creating an experiment. In this plant growth lesson, students identify the different parts of a plant and discuss what is needed for a plant to be successfully grown. Students grow a...
Curated OER
Statistical Inquiry
In this statistical inquiry worksheet, students analyze and interpret a variety of diagrams such as a scatter plot, bar graph and pie charts. They create tables and other diagrams to support given data. This two-page worksheet contains 3...
Curated OER
From Liquid to Gas
Young scholars observe an experiment. In this water lesson plan, students observe as water is changed into vapor. They record their observations by completing a data sheet.
Curated OER
PLANNING A DIVERSIFIED INVESTMENT PORTFOLIO
Twelfth graders research stocks and how to read and interpret financial data. They choose 5 companies to invest in and track their performance over 10 weeks. They create a spreadsheet which shows the results.
Curated OER
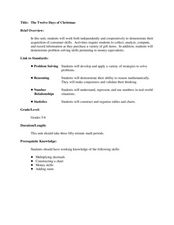
The Twelve Days of Christmas
Students purchase gift items and practice collecting, analyzing, computing, and recording information. In this data lesson plan, students also complete money equivalent activities.
Curated OER
Fruity O Fractions
Fifth graders become mathematical problem solvers using cereal to help demonstrate fractions and equivalent fractions. They use a graph to represent the data, and to compare fractions.
Curated OER
Ratios
Sixth graders investigate the concept of ratios and how they can be used to represent the comparison of quantities. The lesson is taught using a table or graph to compare two categories of data.
Curated OER
Variable Arrays
Twelfth graders compare and contrast variables and arrays. Using data, they enter the information into a spreadsheet and an array to compare how they appear. To end the lesson, they complete basic programs in which they use arrays.
Curated OER
Functions As Graphs Worksheet
In this math worksheet, young scholars graph the data given in the organizer. The functions are used to create the new line for finding the possible unknowns.
Curated OER
Introduction to Inverse Functions
Students investigate patterns of inverse functions. In this algebra lesson plan, students represent functions with the calculator and on paper. They analyze their data and draw conclusions.
Curated OER
Round and Round and Round We Go!
Students investigate motion using a CBL. In this algebra instructional activity, students collect and graph data on a coordinate plane. They define and identify amplitude and period of conic graphs.
Curated OER
Profitable Soda Stand
Am I making any money? Help learners determine if their fictitious soda stand is turning a profit. They graph linear equations using the slope and y-intercept and identify the best price to use to sell soda. They identify the domain and...
Curated OER
When Ants Fly
Here is a great lesson on constructing line graphs. Learners identify common characteristics of birds, ants common needs of all living things. They also write a story from the perspective of an ant or a bird that has lost its home and...
Curated OER
Another Way of Factoring
Focusing on this algebra instructional activity, learners relate quadratic equations in factored form to their solutions and their graph from a number of different aspects. In some problems, one starts with the original equation and...
Howard Hughes Medical Institute
Winogradsky Columns: Microbial Ecology in the Classroom
Winogradsky columns are ideal for observing the role of bacteria and other microorganisms in an ecosystem. This student activity guide is complete with data tables for observations and analysis questions for processing what was observed....
Concord Consortium
King for a Day
Rumor has it exponential functions help solve problems! In a kingdom filled with rumors, young scholars must determine the speed a rumor spreads. The ultimate goal is to decide how many people must know the rumor for it to spread to the...
Curated OER
Creating The Virtual Model
Students engage in a lesson that is about the concept of earthquake design. The lesson includes the integration of technology and how it can be used to create buildings and structures for withstanding an earthquake. Students also define...
Curated OER
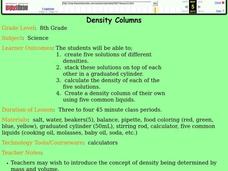
Density Columns
Eighth graders create solutions with 5 different densities. In this chemistry lesson, 8th graders analyze the density of solutions stacked on top of each other. They document their data through graphing. This assignment requires 4 class...
Curated OER
VARIABLES AND PATTERNS, USE AFTER INVESTIGATION THREE. DISCRETE OR CONTINUOUS LINEAR RELATIONS.
Learners discover for which kind of linear function is appropriate to use the "scatter" or the "connected" term. In this instructional activity, students investigate functions using variables, patterns book, graph paper, rulers and the...
Curated OER
Rocket Angles
Eighth graders create rockets that be launched at varying angles to determine which angle is best to launch at for the longest distance.
Curated OER
Curious Clouds
Second graders explore clouds. They read The Cloud Book by Tomie dePola. Students sort the cloud pictures into three categories. Students create a graph using the cloud pictures. They use Excel to create a bar graph.
Curated OER
Is the Rainbow Fair?
Third graders perform statistical calculations. Given a bag of Skittles, 3rd graders sort and collect data regarding the colors included in their bag. Using spreadsheet software, students create a bar graph of the information collected....
Curated OER
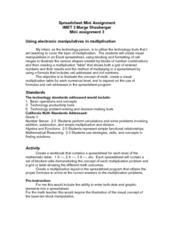
Using Electronic Manipulatives in Multiplication
Factor polynomials using electronic manipulatives. Your class will create a spreadsheet in excel and use it to multiply and perform basic operations and solve problems correctly. They create a visual to go along with each multiplication...


