Curated OER
Temperature Bar Graph
Students explore mean, median and mode. In this math lesson, students analyze temperature data and figure the mean, median, and mode of the data. Students graph the data in a bar graph.
Curated OER
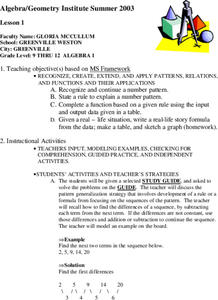
Patterns, Relations, and Functions
Young scholars investigate the patterns of different data sets of numbers. They use critical thinking skills in order to find the missing numbers in any given set. This lesson helps to develop the skill of number sense.
Curated OER
Bias in Statistics
Students work to develop surveys and collect data. They display the data using circle graphs, histograms, box and whisker plots, and scatter plots. Students use multimedia tools to develop a visual presentation to display their data.
Curated OER
Getting A Grip On Graphs
Fourth graders investigate the concept of graphing and comparing different types of data using pictographs, line graphs, scatter plots, etc... They gather data and make interpretations while examining the medium of how it is displayed.
Curated OER
Paws in Jobland: Lesson Plan 35 - Catch of the Day
Students study information for fish farm workers given in the form of a chart, in order to practice interpreting data while learning about the career of a fisherman. In this data interpretation instructional activity, students read the...
Curated OER
Constructing a Periodic Table of Elements
Students create a periodic table of elements. In this chemistry lesson, students work together to build all of the different elements into a complete mini periodic table. They identify similarity and difference of the elements.
Curated OER
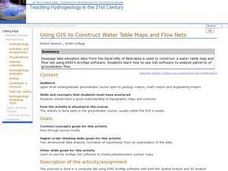
Using GIS to Construct Water Table Maps and Flow Nets
Students examine how to use GIS software to analyze patterns of groundwater flow. Seepage lake elevation data from the Sand Hills of Nebraska is used to construct a water table map and flow net using Esri's Arc Map software.
Curated OER
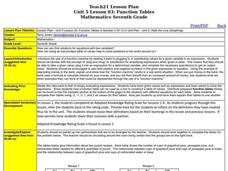
Function Tables
Young scholars identify function using tables of data. In this algebra lesson plan, students create a tale of point and plot on a coordinate plane. They analyze the graph as being a function or not.
Curated OER
Discovering Magnets and Graphs
Sixth graders investigate averages and statistics by discovering magnet strengths. In this magnet experiment lesson plan, 6th graders utilize different magnets and attempt to attract different materials to them. Students record the...
American Statistical Association
A Sweet Task
Candy is always an effective motivator! A fun math activity uses M&M's and Skittles to explore two-way frequency tables and conditional probability. The candy can serve a dual purpose as manipulatives and experimental data.
NASA
Connecting Models and Critical Questions
Scholars use data to analyze and determine which sets of information need to be counted. They create a model to explain differences among chemical elements using graphs to prove concept mastery.
Curated OER
Data Analysis Digital Display
Students create a survey online. In this math lesson, students graph survey data using flisti.com. They share and analyze their classmates' histogram.
Curated OER
Proportionality in Tables, Graphs, and Equations
Students create different methods to analyze their data. In this algebra lesson, students differentiate between proportion and non-proportional graph. They use the TI-Navigator to create the graphs and move them around to make their...
Curated OER
Background of Diseases-- Germs or Genes?
Students explore the background of common diseases. In this personal health lesson, students research causative agents of communicable and non-communicable diseases. Students use their research findings to create data tables in Microsoft...
Curated OER
What Can I Afford?
Students explore the concept of cell phone plans. In this cell phone plan instructional activity, students research the cost of cell phones. Students compare various cell phone plans and decide on which phone plan is best for them.
Curated OER
Matrices: A Secret Weapon
Students perform operations with matrices. In this algebra lesson plan, students use cryptography and cryptanalysis to solve problems. They add, subtract, and multiply matrices.
Curated OER
What is the Best Chip?
Scholars collect data about chips. They pick their favorite type of chip from a given variety such as potato chips, tortilla, or banana chips. Then they write on an index card their favorite chip and why it's their favorite. They also...
EngageNY
Conditional Relative Frequencies and Association
It is all relative, or is it all conditional? Using an exploration method, the class determines whether there is an association between gender and superpower wish through the use of calculating conditional relative frequencies. The last...
Virginia Department of Education
Growing Patterns and Sequences
Learners explore, discover, compare, and contrast arithmetic and geometric sequences in this collaborative, hands-on activity. They build and analyze growing patterns to distinguish which kind of sequence is represented by a set of data...
Curated OER
Make Me Metric
Sixth graders explore standard and nonstandard measurement. In this measurement lesson plan, 6th graders estimate the lengths of different objects and write about their observations during measuring. Students work in groups to measure...
Illustrative Mathematics
Chocolate Bar Sales
In this real-world example, algebra learners start to get a sense of how to represent the relationship between two variables in different ways. They start by looking at a partial table of values that define a linear relationship. They...
Curated OER
Counting Coins
Second graders identify a quarter, dime, penny, nickel, and dime. They match the coin with it's monetary value, collect data on excel spreadsheet, and create a graph in Excel. Students participate in group activities.
Wisconsin Online Resource Center
Oversized Inch
Each member of the class creates their own paper ruler. Using their ruler, kids walk around the room measuring the objects you've specified. Discuss how items should be measured to the 16th of an inch, the smallest unit on their ruler....


