Texas Instruments
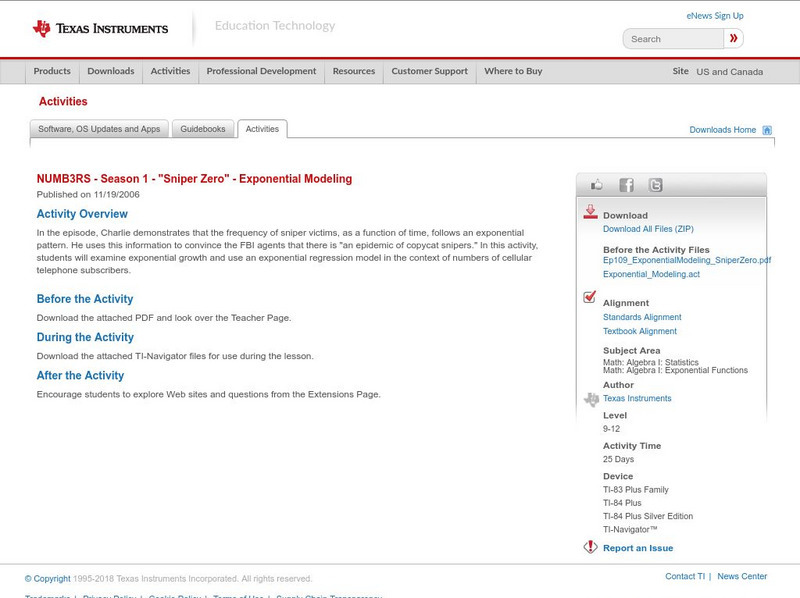
Texas Instruments: Numb3 Rs: Exponential Modeling
Based off of the hit television show NUMB3RS, this lesson introduces students to exponential equations, their graphs, and their application in the real world. The lesson is framed in the context of the number of cell phone users for a...
Texas Instruments
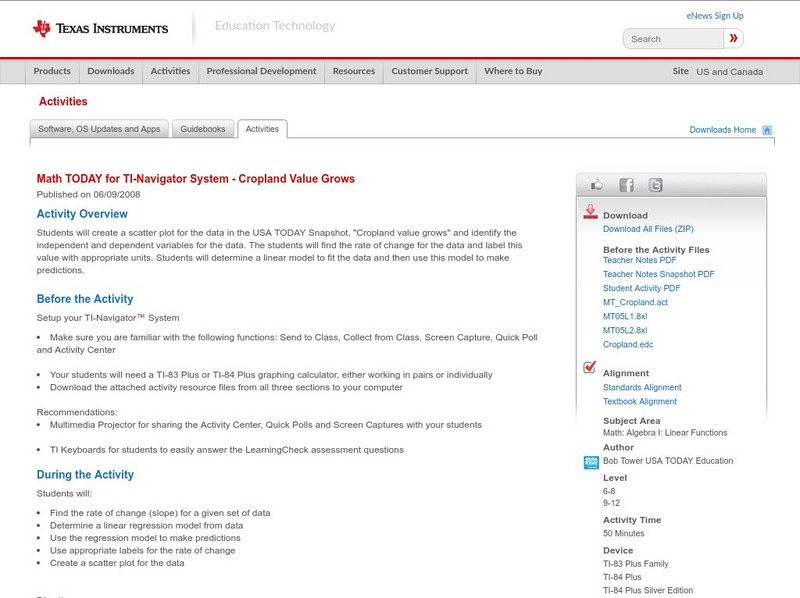
Texas Instruments: Math Today for Ti Navigator System Cropland Value Grows
Students will create a scatter plot for the data in the USA TODAY Snapshot, "Cropland value grows," and identify the independent and dependent variables for the data. The students will find the rate of change for the data and label this...
Texas Instruments
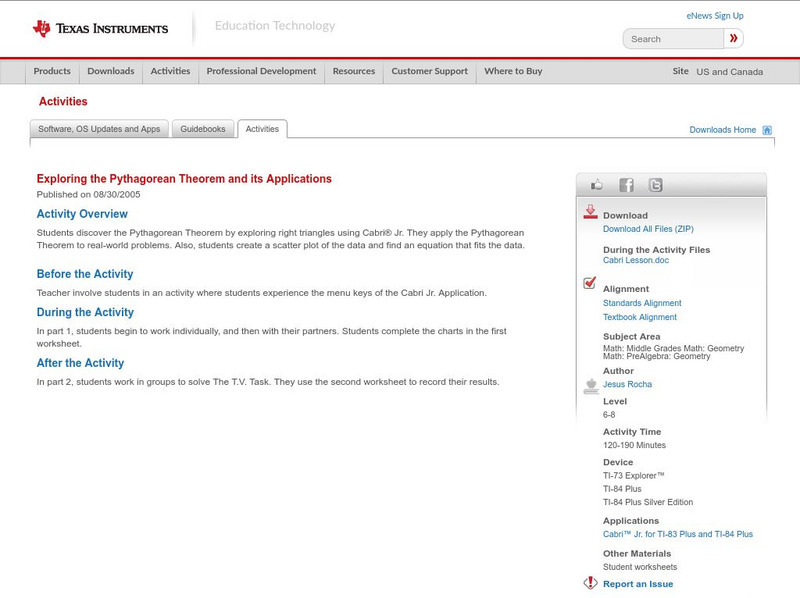
Texas Instruments: Exploring the Pythagorean Theorem and Its Applications
Students discover the Pythagorean Theorem by exploring right triangles using Cabri Jr. They apply the Pythagorean Theorem to real-world problems. Also, students create a scatter plot of the data and find an equation that fits the data.
Texas Instruments
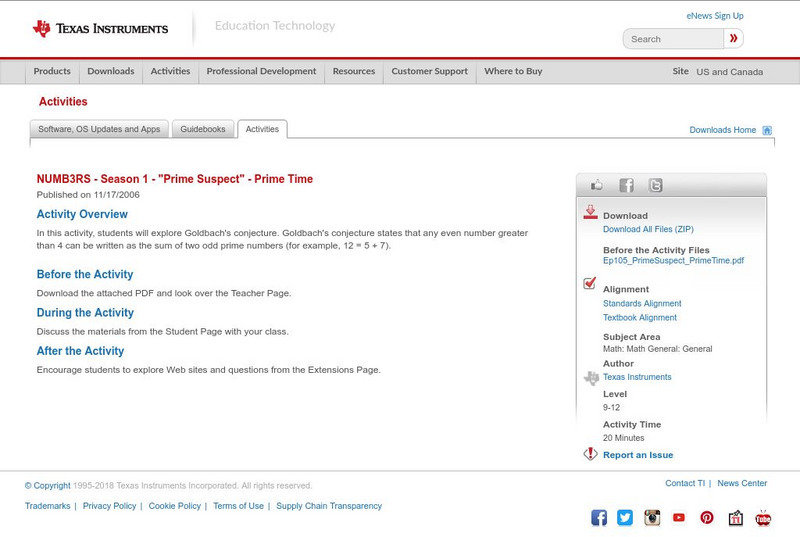
Texas Instruments: Numb3 Rs: Prime Time
Based off of the hit television show NUMB3RS, this lesson helps students understand the Goldbach Conjecture (any even number greater than four can be written as the sum of two odd prime integers). Students explore how many pairs of odd...
CK-12 Foundation
Ck 12: Statistics: Linear Regression Equations
[Free Registration/Login may be required to access all resource tools.] Use a calculator to create a scatter plot and to determine the equation of the line of best fit.
PBS
Pbs Teachers: Sports and Math: Will Women Athletes Ever Catch and Surpass
Explore, explain and make conclusions based on graphs of scatter plots of the Olympic records for men and women in the same event over the same years. Plot x- and y-values, and create linear equations from the data.
Texas Instruments
Texas Instruments: Numb3 Rs: "Take Out" Outliers
Based off of the hit television show NUMB3RS, this lesson has students create box-and-whisker plots for given data, and then determine which (if any) data points are outliers. Students determine outliers through two methods in this...
Texas Instruments
Texas Instruments: Numb3 Rs: Dialing Ben
Based off of the hit television show NUMB3RS, this lesson has students try to discover if there has been a significant change in cell phone use over the course of ten days. If so, this "change point" can be detected by creating a line of...
Other
Nearpod: Scatterplots, Correlation & Lines of Best Fit
In this lesson on scatterplots, young scholars will learn how to create the line of best fit and analyze scatterplots by learning about correlations and causation.
Texas Instruments
Texas Instruments: Beverage Tests
In this activity, students determine the pH of liquid samples. They get familiar with the pH scale, create graphs comparing pH levels, and compare data displayed as a scatter plot, a boxplot, a histogram, and a bar graph.
Rice University
Rice University: The Hand Squeeze
Students will enjoy this data collection and class analysis experiment involving the time it takes for a hand squeeze to travel around a circle of people. From organizing the activity to collecting the data to making a table and graphing...


