Curated OER
How Much Is Too Much?
Young scholars examine population growth and collect data. In this statistics instructional activity, students create a scatter plot to represent the different species found in the water and are being harvested. They graph their data and...
Curated OER
The Graduation Dilemma
Ninth graders explore data analysis. For this Algebra I lesson, 9th graders collect and organize data to create a scatter plot. Students use the regression feature of the calculator to find the line of best fit and use the equation to...
Curated OER
Penny Toss - Exponential Growth and Decay
In this penny toss worksheet, students collect statistical data by tossing pennies and then create a scatter plot of the data. They use formulas for exponential growth and decay and then plot the function. This two-page document...
Curated OER
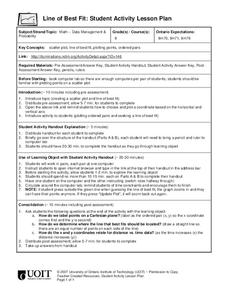
Finding a Line of Best Fit
Pupils engage in the practice of creating a scatter plot with the data obtained from measuring different resting heart rates. The data is used to create the table that is translated into a graph. The lesson gives instructions for the use...
Curated OER
Prescient Grading
Do homework grades really determine test scores? Learn whether lines of best fit, correlation coefficients, and residuals can be used to determine test scores when given homework grades. (It would certainly save teachers time in grading...
Statistics Education Web
NFL Quarterback Salaries
Use statistics to decide if NFL quarterbacks earn their salaries! Learners study correlation coefficients after using technology to calculate regression equations. Through the data, they learn the meaning of correlation and correlation...
West Contra Costa Unified School District
Comparing Data Displays
There is so much more to data than just numbers, and this resource has learners use three methods of comparing data in a multi-faceted lesson. The 21-page packet includes a warm-up, examples, an activity, and assessment for a complete...
Curated OER
Handy Reflections
Learners explore reflections on a coordinate plane in this lesson plan. They trace their hand on a grid, determine the coordinates of each point, and create a scatter plot of their points. Pupils use this information to investigate...
PBL Pathways
Students and Teachers 2
Examine trends in student-to-teacher ratios over time. Building from the first task in the two-part series, classes now explore the pattern of student-to-teacher ratios using a non-linear function. After trying to connect the pattern to...
Curated OER
Super Bowl Champs
In this Super Bowl worksheet, students create line plots of all winners and losers of the Super Bowl. They create stem-and-leaf plots, scatter plots, and bar graphs of football data. This one-page worksheet contains 5 multi-step problems.
Curated OER
Lines of Fit
Young scholars graph an equation and analyze the data. In this algebra lesson, students graph scatter plots and identify the line of best fit using positive correlation, negative correlation an d no correlation. They apply their data...
Curated OER
Sequence Investigation
Eleventh graders investigate arithmetic sequences. In this Algebra II lesson, 11th graders create an arithmetic sequence and explore the effect of each variable in the formula of the nth term of an arithmetic sequence. Students graph...
Curated OER
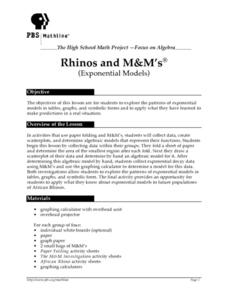
Rhinos and M&M's
Students analyze patterns of exponential models by collecting data in paper folding and M&M investigations. They use graphing calculators to create scatter plots that lead to equations for the exponential models. They then apply this...
Curated OER
Geometric Sequences and Series
Learners find common ratios of geometric sequences on a spreadsheet. Using this data, they create scatter plots of the sequences to determine how each curve is related to the value of the common ratio. They will consider whether series...
Curated OER
Strike a Pose: Modeling in the Real World (There's Nothing to It!)
Adjust this lesson to fit either beginning or more advanced learners. Build a scatter plot, determine appropriate model (linear, quadratic, exponential), and then extend to evaluate the model with residuals. This problem uses real-world...
Rice University
Introductory Statistics
Statistically speaking, the content covers several grades. Featuring all of the statistics typically covered in a college-level Statistics course, the expansive content spans from sixth grade on up to high school. Material comes from a...
Curated OER
VARIABLES AND PATTERNS, USE AFTER INVESTIGATION THREE. DISCRETE OR CONTINUOUS LINEAR RELATIONS.
Students discover for which kind of linear function is appropriate to use the "scatter" or the "connected" term. In this lesson, students investigate functions using variables, patterns book, graph paper, rulers and the graphit program.
Curated OER
Test On Analytic Geometry/ Play Green Globs
Students engage in a lesson plan that focuses on analytic geometry. The lesson plan asked them to apply skills of relating equations when plotting them on the coordinate plane. Students construct the equations using specific criteria and...
Curated OER
Lines of Fit
Students solve equations dealing with best fit lines. In this algebra lesson, students solve problems by analyzing data from a scatterplot, and define it as positive, negative or no correlation. They classify slopes the same way as...
Curated OER
Lines of Fit
Students analyze graphs. In this algebra lesson, students find the line of best fit, using scatter plots. They calculate the sale of popcorn as it relates to the price. They then analyze the graphs for positive, negative and no correlation.
Curated OER
comparison of Two Gender Sports Teams
Learners gather data on sports team and create a box and whisper plot. In this data collection lesson, students find the median, the quartile range, and relationships between variables.
Curated OER
Around and Across
Tenth graders investigate the circumference and diameter of a circle. In this geometry lesson, 10th graders relate circumference to diameter. They create a scatter plot to estimate the value of pi.
Curated OER
Line of Best Fit
Students calculate the equation of the line of best fit. In this statistics lesson, students create scatter plots and find the line of best fit going through their data. They make predictions and draw conclusions.
Curated OER
Correlate This!
Students investigate different correlations. In this algebra instructional activity, students analyze graphs and identify the lines as having positive, negative or no correlation. They calculate the line of best fit using a scatter plot.


