Curated OER
I Can Average Grades Like My Teacher!!!
Fifth graders investigate the mean of a data set. In this fifth grade mathematics lesson, 5th graders determine the mean of sets of numbers using a calculator. Students use a blank role book page to create grades for students and work...
Curated OER
Analyzing Health
Third graders analyze their health. In this analysis lesson plan, 3rd graders rate their health on a 1-10 scale. They then tally the scores from the class and create a data chart. Then they answer true and false questions based on...
Curated OER
An Introduction to Sensors
Pupils list as many examples as they can of sensors in their homes and/or automobiles, define sensor and discuss what qualifies devices as sensors, explore human eyes as sensors while watching teacher demonstration, recognize that sensor...
Curated OER
An "Average" Golf Score
Ninth graders investigate mean, median, and mode. In this mean, median, and mode lesson, 9th graders research gold data for the top ten scores in two golf tournaments. Students make tables and graphs of the data. Students determine...
Curated OER
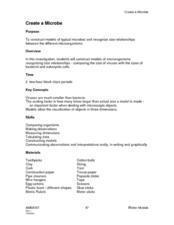
Create a Microbe
Young scholars construct models of microorganisms recognizing size relationships-comparing the size of viruses with the sizes of bacterial and eukaryotic cells. They put into perspective just how small microbes are by comparing the size...
Curated OER
Create A Park Map
Students design ultimate park experience for Florida families as they demonstrate their knowledge of map legend skills.
Curated OER
Create and Locate Your Own Business
High schoolers simulate the creation of their own business. Using the internet and database exploration, they research community profiles and select a business. Pupils define the target market and investigate a business location. ...
Curated OER
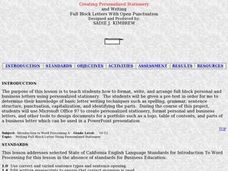
Creating Personalized Stationery
Students write, format, enter, save, revise, edit a full block style letter with open punctuation for printing. They produce a personalized letterhead using a computer and access information from the Internet using a variety of search...
Curated OER
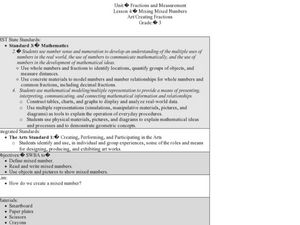
Mixing Mixed Numbers Art/Creating Fractions
Third graders explore number values by participating in class math activities. In this fractions lesson, 3rd graders collaborate with classmates to discuss the technique of adding mix numbers while utilizing paper plates to help...
Curated OER
Survey Says...
Young learners create and implement a school-wide survey about student body favorites! Learners record and analyze the data on a bar graph, picture graph, and line graph, and then display the data. Then, wrap it all up with a celebration...
Curated OER
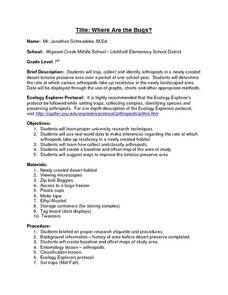
Where Are the Bugs?
Students trap, collect and identify arthropods in a newly created desert tortoise preserve area over a period of one school year. They determine the rate at which various arthropods take up residence in the newly landscaped area. Data is...
Curated OER
Creating a Bar Graph with a Graphing Program
Students use the S'COOL data base to create a bar graph.
Curated OER
Using Averages to Create Graphs Through Excel
Sixth graders create and use a spreadsheet to make graphs which will be used to analyze Progress Report and Final Report Card grades. They practice finding the mean, median, mode, and range of a data set. Students also incorporate column...
Curated OER
Graphing Data
Second graders examine how to make and read bar graphs. In this bar graph lesson, 2nd graders compare bar graphs to pictographs by looking at hair color survey data. They practice making a bar graph and finding the range of the data.
Curated OER
Univariate Data Analysis
Students use given data to compare baseball players. They create box and whisker plots to compare the players and determine which they feel is the best player. Students use calculators to make box and whisker plots. They write paragraphs...
Curated OER
Creating and Analyzing Graphs of Tropospheric Ozone
Students create and analyze graphs using archived atmospheric data to compare the ozone levels of selected regions around the world.
Curated OER
Creating a Thematic Map Using S'COOL Data
Students observe weather patterns, collect data, and make a weather predictions for various locations on a map.
Curated OER
Rouge River Data
Students participate in using Excel sofware in order to create graphs. They create the graphs using data that they gathered during the Rouge River Field Trip they attended. The produce bar graphs from the excel spreadsheets.
Curated OER
Creating The Virtual Model
Students engage in a lesson that is about the concept of earthquake design. The lesson includes the integration of technology and how it can be used to create buildings and structures for withstanding an earthquake. Students also define...
Curated OER
Yaba "Data" Cereal
Fifth graders create and modify a database using information from cereal labels.
Curated OER
Saving Energy Through Ecological Landscape Design
Students are able to transcribe to scale the plant features of a common landscape. They determine true north and south and collect and record data on a table. Students calculate a rating for and describe a definition of insulation and...
Curated OER
My Family Tree
Students create a family tree. In this ancestry instructional activity, students research a country that one of their ancestors is from. Students interview a grandparent and map out a family tree.
Curated OER
Profitable Soda Stand
Am I making any money? Help learners determine if their fictitious soda stand is turning a profit. They graph linear equations using the slope and y-intercept and identify the best price to use to sell soda. They identify the domain and...
Curated OER
When Ants Fly
Here is a great lesson on constructing line graphs. Learners identify common characteristics of birds, ants common needs of all living things. They also write a story from the perspective of an ant or a bird that has lost its home and...


